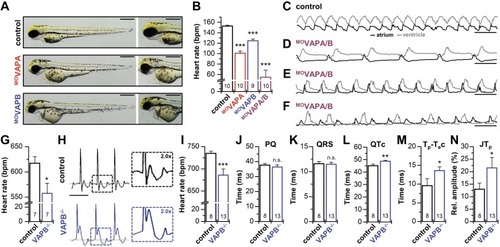
Bradycardia in knock-down zebrafish embryos and VAPB−/− mice. A) Zebrafish embryos at 72 hpf. Control-injected and MO-injected embryos against VAPA (MOVAPA) or VAPB (MOVAPB) exhibit no significant abnormalities (left), particularly no structural heart defects (right). Note a light cardiac edema in MOVAPB and a strong edema in MOVAPA. B) Heart rate in beats per minute (bpm) of control and MOVAPA, MOVAPB, or MOVAPA/B injected zebrafish embryos at 72 hpf. C) Representative examples of calcium transients (relative fluorescence intensity) in the cardiac atrium (black) and cardiac ventricle (gray) of control-injected zebrafish at 72 hpf, displaying a regular atrio-ventricular propagation of excitation from atrium to ventricle in a 1:1-ratio. D, E), Representative calcium transients recorded in MOVAPA/B double knock-down morphants, illustrating strongly reduced heart rates with variable frequency. F) Representative example of atrial and ventricular calcium measurements from a MOVAPA/B morphant with a 2:1 atrio-ventricular block, in which only every second atrial excitation leads to a ventricular excitation. Data were obtained from 3 independent batches of injections (A–F). G) Heart rate in beats per minute (bpm) of VAPB−/− mice compared with wild-type littermates (control), analyzed by using tail-cuff measurements. H) Representative surface ECG recordings of VAPB−/− mice and their wild-type littermates (control). ECGs of VAPB−/− mice show bradycardia and an increased T-wave amplitude. I–N) Analyses of the ECG parameters of VAPB−/− mice. I) Heart rate in beats per minute (bpm). J) PQ interval (PQ) duration. K) QRS complex (QRS) duration. L) Frequency corrected QT interval (QTc). M) Frequency-corrected Tpeak to Tend duration (Tp-Tec). N) T-wave amplitude (JTp). Scale bars: 500 µm (A); 500 ms (C–F), and 100 ms (H). All data are presented as means ± sem. The number of animals (n) is indicated in the respective bar graphs. N.s., not significant. *P < 0.05, **P < 0.01, ***P < 0.001 [Student’s t test (G, H, J–N) or Welch’s t test (B, I)].
|
