
FIGURE
Figure 6
- ID
- ZDB-FIG-190723-934
- Publication
- Saunders et al., 2019 - Thyroid hormone regulates distinct paths to maturation in pigment cell lineages
- Other Figures
- All Figure Page
- Back to All Figure Page
Figure 6
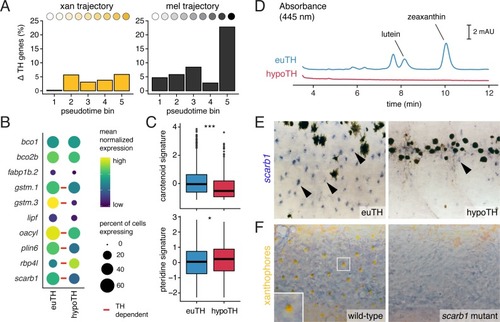
UMAP plots of pigment cell clusters colored by expression of TH-dependent genes in xanthophores: |
Expression Data
| Gene: | |
|---|---|
| Fish: | |
| Condition: | |
| Anatomical Term: | |
| Stage: | Days 21-29 |
Expression Detail
Antibody Labeling
Phenotype Data
| Fish: | |
|---|---|
| Condition: | |
| Observed In: | |
| Stage: | Days 21-29 |
Phenotype Detail
Acknowledgments
This image is the copyrighted work of the attributed author or publisher, and
ZFIN has permission only to display this image to its users.
Additional permissions should be obtained from the applicable author or publisher of the image.
Full text @ Elife