IMAGE

Figure 6

ID
ZDB-IMAGE-190723-976
Genes
Source
Figures for Saunders et al., 2019
Image
Figure Caption

Figure 6 Expression of multiple carotenoid-related genes in xanthophores are affected by TH.

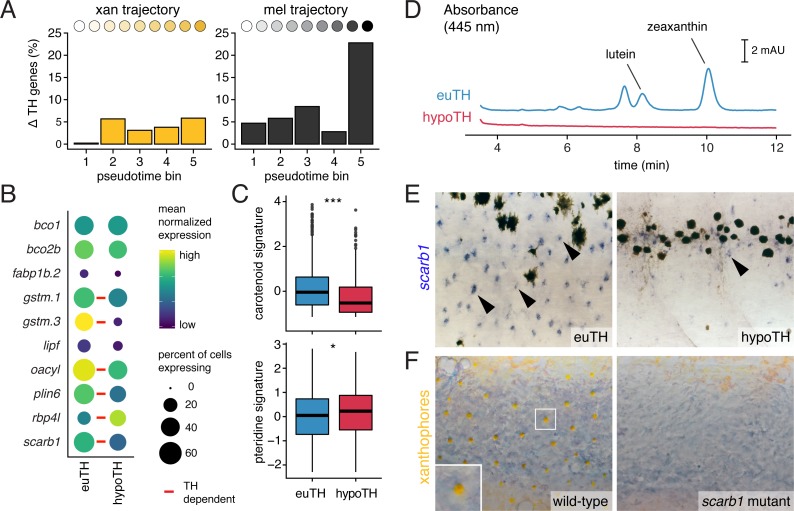
UMAP plots of pigment cell clusters colored by expression of TH-dependent genes in xanthophores: gstm.3 (q = 6.9E-99, log2fold-change = 4.3), plin6 (q = 1.9E-13, log2fold-change = 1.3), scarb1 (q = 3.5E-11, log2fold-change = 1.2).

10.7554/eLife.45181.025Xanthophore lipid droplet incidence corresponding to <xref rid='fig6s2' ref-type='fig'>Figure 6—figure supplement 2A</xref>.

Figure Data
Acknowledgments
This image is the copyrighted work of the attributed author or publisher, and ZFIN has permission only to display this image to its users. Additional permissions should be obtained from the applicable author or publisher of the image. Full text @ Elife