
Figure 3
- ID
- ZDB-FIG-190723-2589
- Publication
- Wei et al., 2018 - Lipid-Lowering Effect of the Pleurotus eryngii (King Oyster Mushroom) Polysaccharide from Solid-State Fermentation on Both Macrophage-Derived Foam Cells and Zebrafish Models
- Other Figures
- All Figure Page
- Back to All Figure Page
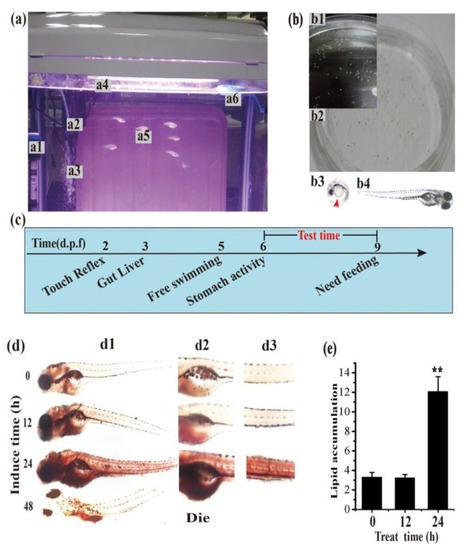
Establishment of the zebrafish larvae hyperlipidemia model. (a) Photographs of zebrafish during breeding. Adult zebrafish (a5) were fed with live brine shrimp twice daily and housed in a light- and temperature-controlled aquaculture facility (a) installed with a thermometer (a1), heating rods (a1), a filter device (a2), an oxygen pump (a3), lamp (a4), and a feeding ring (a6) with a standard 14:10 h light/dark cycle at 28 °C in fish water. Four to five pairs of adult zebrafish were set up for natural mating every time; (b) Representative photographs of zebrafish embryos and larvae. On average, 200–300 embryos (b1) are generated. Embryos and larvae (b2) were maintained at 28 °C in fish water on the open plate in the light of the incubator. Microphotographs showing that the zebrafish embryos (b3) and larvae (b4) are transparent all the way around except for little black scales on the body surface by a dissecting stereo microscope; (c) The developmental introduction of zebrafish larvae. Zebrafish larvae of 6 days post-fertilization (d.p.f.) begin to show stomach activity and can live without food supplementation within 9 d.p.f. Thus, zebrafish larvae at 6 d.p.f. were selected for the experiment model in the next experiment; (d) Representative microphotographs of the whole body (d1), the gut (d2) and the blood vessels (d3) with red stainable lipids induced by the high-cholesterol diet (HCD) at different times (0, 12, 24, 48 h) in the zebrafish larvae hyperlipidemia model by a dissecting stereomicroscope. Stainable lipids in the zebrafish larvae increased uniformly and suddenly with feeding time from 12 to 24 h and caused death at 48 h; (e) Normalized quantification data of stainable red lipid content correlated to microphotographs (d) in the zebrafish hyperlipidemia model.
|
| Fish: | |
|---|---|
| Condition: | |
| Observed In: | |
| Stage: | Days 7-13 |