FIGURE

Figure 2

ID
ZDB-FIG-190723-2206
Publication
Jessop et al., 2018 - Developmental Functions of the Dynamic DNA Methylome and Hydroxymethylome in the Mouse and Zebrafish: Similarities and Differences
Other Figures
All Figure Page
Back to All Figure Page
Figure 2

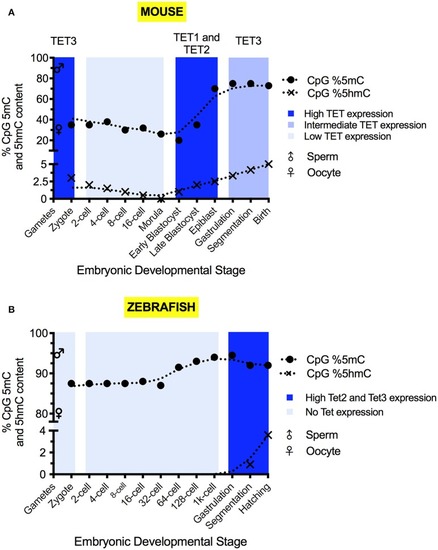
The 5mC and 5hmC content of the mouse (A) and zebrafish (B) during development. 5mC and 5hmC content are expressed as % of genomic CpG sites. Solid circles represent the overall genomic CpG 5mC status (Jiang et al., 2013; Amouroux et al., 2016; Okamoto et al., 2016; Guo et al., 2017), with crosses representing the overall genomic CpG 5hmC status (Pastor et al., 2013; Wu and Zhang, 2014; Kamstra et al., 2015; Amouroux et al., 2016). Sex symbols indicate the 5mC content of sperm or oocytes. Blue panels represent the general expression level of TET mRNA at particular stages (Yamaguchi et al., 2012; Ge et al., 2014; Amouroux et al., 2016; Bogdanović et al., 2016). X-axes labels indicate the developmental stage of the embryo, with shared positions being analogous between species.

Expression Data

Expression Detail
Antibody Labeling
Phenotype Data

Phenotype Detail
Acknowledgments
This image is the copyrighted work of the attributed author or publisher, and ZFIN has permission only to display this image to its users. Additional permissions should be obtained from the applicable author or publisher of the image. Full text @ Front Cell Dev Biol