
Figure 5
- ID
- ZDB-FIG-190723-2094
- Publication
- Meier et al., 2018 - Color Processing in Zebrafish Retina
- Other Figures
- All Figure Page
- Back to All Figure Page
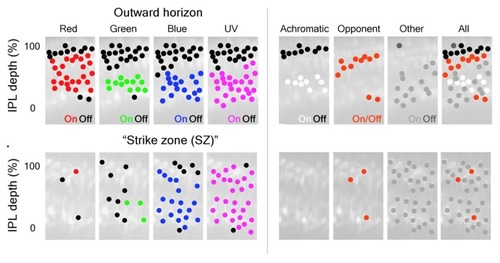
Color inputs to inner retina are segregated in the IPL. BC terminals in the larval zebrafish IPL can be segregated based on the spectral inputs they respond to across the visual scene. (Left) BC-terminal excitation by R, G, B, and UV stimuli are represented as red, green, blue and magenta dots located throughout the IPL; inhibitory responses are represented as black dots. The distribution of ON-responses varies based on the spectral stimulus and which part of the visual scene (outer horizon vs. “strike zone (SZ)”) is being viewed. The “SZ” represents looking forward and upward at prey items. (Right) Subsequent classification of the different spectral inputs from BCs into the IPL identified achromatic and color-opponent regions in this synaptic layer that were most evident outside the “SZ”. For the right panels: black dots = achromatic OFF-responses, white dots = achromatic ON-responses, red dots = color-opponent responses, gray dots = “other” (taken from Figure 3, Zimmermann et al., |