|
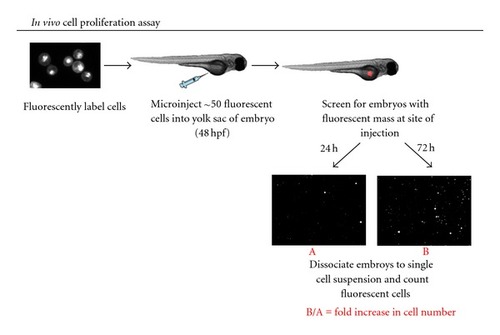
Schematic of in vivo cell proliferation assay in xenotransplanted zebrafish embryos. Human leukemia cells are fluorescently labelled with a cell tracking dye. Approximately 25–50 fluorescently labelled cells are microinjected into the yolk sac of 48 hpf casper embryos. Embryos are screened using fluorescent microscopy for the presence of a fluorescent mass at the site of injection. Positive embryos are divided into two groups; one of which is maintained at 35C for 24 h, and the other group is maintained for until the time point of interest with or without drug exposure. At the end of each time point embryos are enzymatically dissociated to a single cell suspension and the number of fluorescent cells in the suspension is counted using a semiautomated macro in Image J (NIH, Bethesda, MD). The number of fluorescent cells present at the later time point divided by the number of fluorescent cells present at 24 h represents the fold increase in cell number. Adapted from Corkery et al. [90].
|