
Fig 5
- ID
- ZDB-FIG-190723-1384
- Publication
- Buchan et al., 2019 - A transgenic zebrafish line for in vivo visualisation of neutrophil myeloperoxidase
- Other Figures
- All Figure Page
- Back to All Figure Page
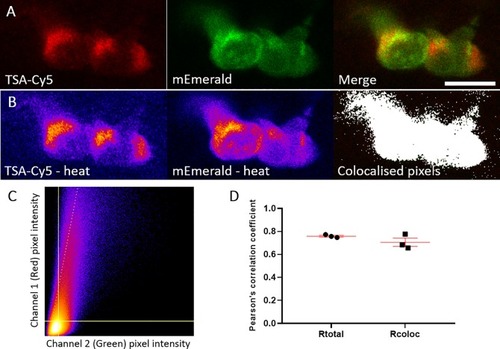
mEmerald signal colocalises with TSA signal. A) Representative photomicrograph shown as single focal plane of lyz:MPO-mEmerald (Green) larvae fixed at 3 dpf and chemically stained with TSA-Cy5 (Red). Scale bar 10 μm. B) Pseudocoloured (heat) images of Red and Green channels and image of colocalised pixels above threshold. C) Scatter plot of channel 1 (Red) vs. channel 2 (Green) of the image shown in A and B. The regression line is plotted along with the threshold level for channel 1 (vertical line) and channel 2 (horizontal line). D) Pearson's correlation coefficient for the entire image (Rtotal) or for the pixels above thresholds (Rcoloc) of 3 tested field of views. Mean +/- SEM are indicated in red. |