|
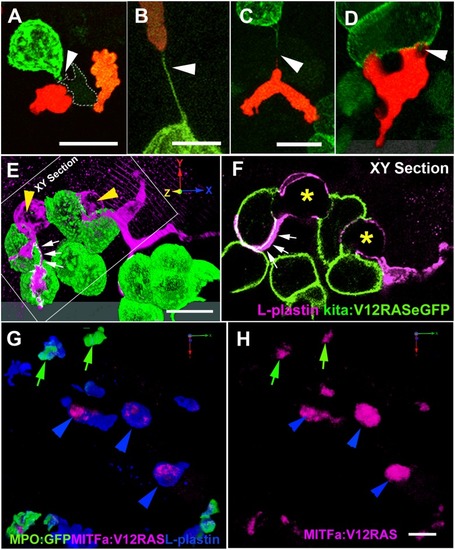
Dynamic interactions between leukocytes and V12RAS<sup>+</sup> transformed cells.(A) A confocal image of a LysC:DsRed+ (red) cell and a macrophage (pale green with dotted line outline) interacting with a V12RAS+ cell (green) (Video S8). (B, C) Images showing LysC:DsRed+ leukocytes establishing tethers with V12RAS+ cells, as observed in Tg(Fli:GFP; LysC:DsRed; kita:GalTA4; UAS:V12RASeGFP) larvae: (B) shows a tether entirely composed of V12RAS cytoplasm (green) (Video S9); (C) shows a chimeric tether composed of both V12RAS (green) and LysC:DsRed+ (red) cytoplasm. (D) A single image from a 3D movie (Video S10), of a neutrophil as it glides over and engulfs pieces of a V12RAS+ cell; (E) 3D reconstruction of a V12RAS+ cell clump (green cells) showing two macrophages (L-plastin+, magenta staining–yellow arrowheads) as they deform to engulf individual V12RAS+ cells. Small white arrows and dotted outline indicates lamellipodial protrusions extending over another pair of transformed cells. (F) A single focal plane (corresponding to that indicated in [E]) of the same pair of macrophages, showing V12RAS+ cell shaped phagosomes (asterisks), within them. One macrophage has partially enveloped another V12RAS+ cell with a thin lamellipodial extension (indicated by small white arrows). (G) 3D reconstruction of an anti-L-plastin stained mitfa:V12RAS-mitfa:mCherry injected Tg(BACMPO:eGFP) i114 larval flank region, showing the presence of mCherry+ (red) debris within L-plastin+MPO- cells. (H) Image as in (G) but with single channel to highlight the mCherry+ V12RAS+ debris; green arrows indicate co-localization within L-plastin+ MPO+ neutrophils; blue arrowheads indicate co-localization within L-plastin+ MPO- macrophages. Note that the larger clumps of debris all reside within macrophages. The grey tonal bars/domains at the bottom of (D) and (E) are the “floor” effect offered by Velocity software when generating a 3D reconstruction from a “Z-stack” of optical sections. Scale bars = 8 μm.
|