FIGURE

Figure 4—figure supplement 2.

ID
ZDB-FIG-190723-1067
Publication
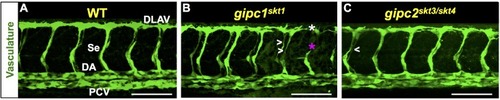
Carretero-Ortega et al., 2019 - GIPC proteins negatively modulate Plexind1 signaling during vascular development
Other Figures
All Figure Page
Back to All Figure Page
Figure 4—figure supplement 2.

Angiogenesis deficits of <italic>gipc1<sup>skt1</sup></italic> and <italic>gipc2 <sup>skt3/skt4</sup></italic> mutants at 32 hpf.

(A–C) Confocal lateral images of the trunk vasculature (green) of 32 hpf embryos (region dorsal to the yolk extension). Anterior, left; dorsal, up. Scale bars (white horizontal lines), 100 μm. Genotypes indicated on top of each image in yellow font. Angiogenesis deficits are indicated as follows: white asterisks (DLAV gaps), magenta asterisks (truncated Se), white greater/less-than signs (thin Se). In the WT image (A), the vessels are designated with the white font as follows: DLAV (Dorsal Longitudinal Anastomotic Vessel), Se (Segmental Vessel), DA (Dorsal Aorta), and PCV (Posterior Cardinal Vein). Related to Figure 4.

Expression Data

Expression Detail
Antibody Labeling
Phenotype Data
Fish:
Observed In:
Stage: Prim-15

Phenotype Detail
Acknowledgments
This image is the copyrighted work of the attributed author or publisher, and ZFIN has permission only to display this image to its users. Additional permissions should be obtained from the applicable author or publisher of the image. Full text @ Elife