
Fig. 2
- ID
- ZDB-FIG-190718-9
- Publication
- Eno et al., 2019 - Aggregation, segregation and dispersal of homotypic germ plasm RNPs in the early zebrafish embryo
- Other Figures
- All Figure Page
- Back to All Figure Page
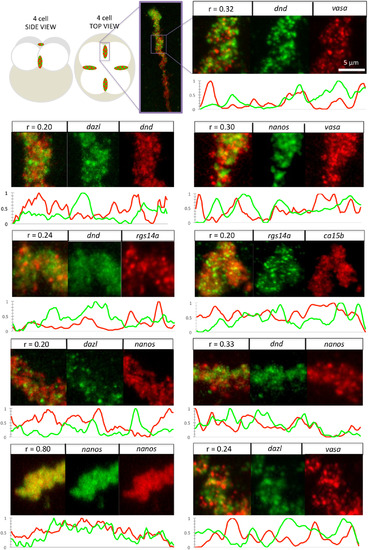
Correlation as a measure of RNA localization within germ plasm aggregates. Diagram of whole embryo with insets indicating location of furrow aggregates, followed by micrographs (merge and channel separated) of magnified regions. Furrow aggregates labeled to detect two germ plasm RNAs as indicated. Pearson's coefficient for combinations of two different RNAs ranges from 0.20 to 0.33, in contrast to control labelings for the same RNA targeted by differently labeled probes (nanos/nanos: r = 0.80). For each double labeling combination, 10‐μm section line scans of fluorescence intensity of separate channels along each aggregate show that fluorescence in embryos labeled for two different RNAs exhibit divergent peak distribution, in contrast with the control labeled nanos/nanosaggregate, where fluorescence distributions run largely in parallel. Fluorescence intensity values (y‐axis) are min‐max normalized to a scale of 0–1. All images are confocal Z‐projections. Scale bar = 5 μm. |