
FIGURE
Fig. S13
Fig. S13
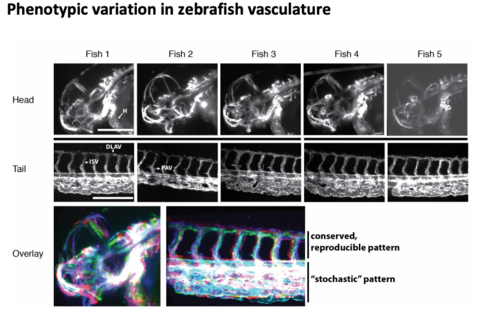
Phenotypic variation of zebrafish vasculature Five zebrafish expressing the vasculature marker Tg(kdrl:lifeactGFP) (Vanhollebeke et al., 2015) at 35 hpf were imaged using SPIM. Maximum projections f the head and tail of five different individual zebrafish embryos (H, heart; DLAV, dorsal longitudinal anastomotic vessel; ISV, intersegmental vessels; PAV, parachordal vessel). Scale bar: 0.25 mm. Overlay of the head and the tail parts revealed different degrees of variation in the vasculature. The bright white signal indicates maximum overlap. |
Expression Data
Expression Detail
Antibody Labeling
Phenotype Data
Phenotype Detail
Acknowledgments
This image is the copyrighted work of the attributed author or publisher, and
ZFIN has permission only to display this image to its users.
Additional permissions should be obtained from the applicable author or publisher of the image.
Full text @ Development