
Fig. S8
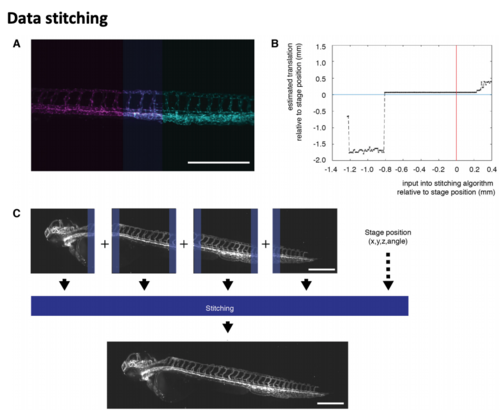
Combining multiple acquisition volumes into one image: data stitching (A) Stitching of two images (magenta and cyan) zebrafish expressing the vascular marker Tg(kdrl:EGFP) (Jin et al., 2005). The overlap between the two images is highlighted in violet. (B) To automatically calculate the stitching of the two images in (A), an initial offset was set to initilize the calculation. Varying this offset revealed that it was robust over a large range of initialization values. Nevertheless, stitching became unreliable if the value were too far off from the assumed offset given by the translation (black line) was close to the physical coordinate given by the stage position (blue line) but not exaact (0.06 mm/53 pixels away). therefore, using the stage position was a reasonable estimate for initialization. (C) In our implemebtation, the stitching generated a final outputimage. Here, a zebrafiah expressing the vascular marker Tg(kdrl:Hsa.HRASmCherry) (Chi et al., 2008) is shown. |