
FIGURE
Fig. 3
- ID
- ZDB-FIG-190701-10
- Publication
- Cal et al., 2019 - Countershading in zebrafish results from an Asip1 controlled dorsoventral gradient of pigment cell differentiation
- Other Figures
- All Figure Page
- Back to All Figure Page
Fig. 3
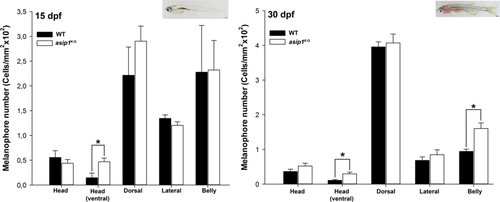
Dorsal-ventral distribution of melanophores during metamorphosis. (A) Distribution and number of melanophores in 15 dpf WT and asip1K.O. fish. At this stage, asip1K.O. already shows significantly higher number of melanophores in the ventral view of the head. (B) Distribution and number of melanophores in WT and asip1K.O. 30 dpf fish. At this stage, asip1K.O. shows significantly higher number of melanophores in the ventral view of the head, but also in the belly. Data are the mean ± SEM, n = 7. Asterisks indicate significant differences between WT and asip1K.O. fish. Scale bar: (A) 200 μm, (B) 500 μm.
|
Expression Data
Expression Detail
Antibody Labeling
Phenotype Data
| Fish: | |
|---|---|
| Observed In: | |
| Stage Range: | Days 14-20 to Days 30-44 |
Phenotype Detail
Acknowledgments
This image is the copyrighted work of the attributed author or publisher, and
ZFIN has permission only to display this image to its users.
Additional permissions should be obtained from the applicable author or publisher of the image.
Full text @ Sci. Rep.