
Fig. 5-S1
- ID
- ZDB-FIG-190611-25
- Publication
- Matty et al., 2019 - Potentiation of P2RX7 as a host-directed strategy for control of mycobacterial infection
- Other Figures
- All Figure Page
- Back to All Figure Page
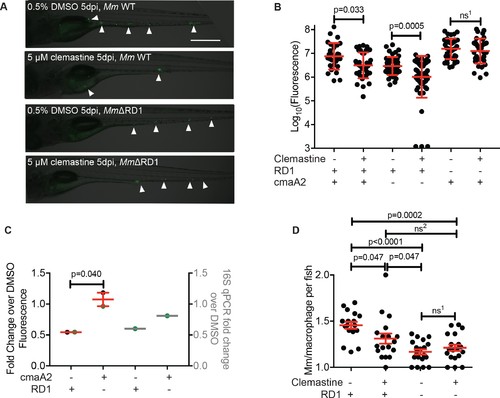
Clemastine does not enhance microbicidal macrophage activities in MmΔRD1 infections. (A) Representative animals from the red dots in Figure 5A. Animals were infected with Mm:Wasabi(~50 CFU) and Mm:ΔRD1:Wasabi (~ 50 CFU) and treated with 0.5% DMSO or 5 μM clemastine, 5 dpi. Scale bar is 500 μm. (B) Bacterial burden per animal assessed by fluorescence 5 days post-infection after treatment with 0.5% DMSO or 5 µM clemastine. Infections were performed with Mm:tdTomato (RD1+ and cmaA2+), Tn01901:mCerulean (cmaA2-) or Mm:ΔRD1:Wasabi (RD1-). Each dot represents a single animal bacterial burden by fluorescence, represented as fold chance over DMSO in Figure 5—figure supplement 1C. Representative of two independent experiments. (C) Fold change in bacterial burden per experiment assessed by fluorescence of bacteria (left y-axis) or 16S rRNA qPCR (right y-axis, gray error bars). The experiment in Figure 5—figure supplement 1B is represented with green dots. Each bacterial strain is normalized to the DMSO-treated control within each bacterial strain. (D) Number of Mm:Wasabi or Mm:ΔRD1:Wasabi bacteria per macrophage during treatment with 0.5% DMSO or 5 μM clemastine, 1 dpi. Each dot represents the average number of Mm:Wasabi bacteria inside the macrophages of Tg(mfap4:tdTomato)xt12 of a zebrafish larva. Representative of three experiments. (B) Ordinary one-way ANOVA with Sidak’s multiple comparison test within bacterial strains, ns1 = 0.8757. Error bars are s.d. (C) Paired t-test on left y-axis. Error bars are s.e.m. No statistics were performed on the right y-axis, represents one biological replicate performed in triplicate. (D) Ordinary one-way ANOVA with Holm-Sidak’s multiple comparison test, ns1 = 0.4243, ns2 =0.1495. All error bars are s.e.m., p values from all transformed and untransformed data are provided in Supplementary file 3. |