
Fig. 2
- ID
- ZDB-FIG-190611-22
- Publication
- Matty et al., 2019 - Potentiation of P2RX7 as a host-directed strategy for control of mycobacterial infection
- Other Figures
- All Figure Page
- Back to All Figure Page
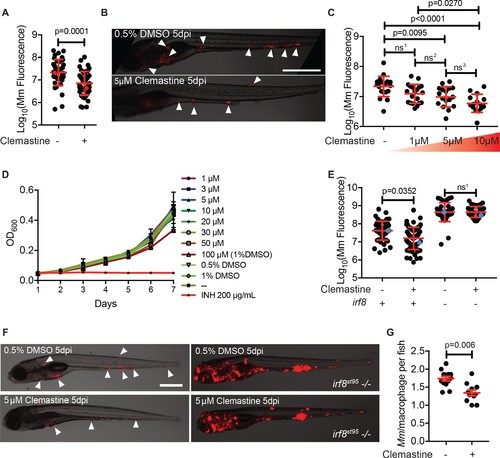
Clemastine activity is host-dependent, dose-responsive, and requires macrophages.(A) Bacterial burden per animal assessed by Mm:tdTomato fluorescence 5 days post infection (dpi) after treatment with 0.5% DMSO vehicle or 5 µM clemastine. Red dots denote the corresponding image shown in Figure 2B. Representative of five experiments. (B) Representative images from experiment in Figure 2A (red dots). Mm:tdTomato infection treated with 0.5% DMSO vehicle or 5 µM clemastine in 0.5% DMSO. White arrows denote regions of bacterial foci. Scale bar is 500 µm. (C) Quantification of Mm:tdTomato fluorescence at 5 dpi in zebrafish larvae treated with increasing concentrations of clemastine. (D) Mm:tdTomato bacterial broth culture grown in the presence of increasing concentrations of clemastine, compared to 0.5% DMSO, 1% DMSO, no vehicle (-), and 200 µg/mL isoniazid. (E) Bacterial burden of wildtype and heterozygous siblings or irf8st95 mutants, which lack macrophages, treated with 0.5% DMSO or 5 µM clemastine. Blue dots indicate animals in Figure 2F. Data are pooled from two biological replicates. (F) Representative infections from irf8st95 mutants and wildtype/heterozygous siblings from each treatment group in Figure 2E at 5 dpi. Wildtype animals (left) were equally brightened (no change in gamma settings) to show contrast of bacteria and brightfield. The irf8st95-/- example animals (right) were not brightened. (G) Number of bacteria per macrophage during treatment with 0.5% DMSO or 5 µM clemastine, 1 dpi. Each dot represents the mean number of intracellular Mm:mCerulean bacteria inside macrophages of one Tg (mfap4:tdTomato)xt11 animal at 24 hpi infected with ~ 50 CFU. Representative of three independent experiments. (A) Two-tailed, unpaired t-test. (C) Ordinary one-way ANOVA with Tukey’s multiple comparison test, ns1 = 0.0864, ns2 = 0.7799, ns3 = 0.2415. Post-test for linear trend, p<0.0001. (E) Kruskal-Wallis ANOVA for unequal variances with Dunn’s multiple comparisons test, ns1 > 0.9999 (A,C,E) Error bars are s.d. (G) Two-tailed unpaired t-test; error bars are s.e.m. p-Values from statistical tests on untransformed data are provided in Supplementary file 2. |
| Fish: | |
|---|---|
| Conditions: | |
| Observed In: | |
| Stage: | Days 7-13 |