
Fig. 8
- ID
- ZDB-FIG-190604-7
- Publication
- Shi et al., 2018 - Optical imaging of metabolic dynamics in animals
- Other Figures
- All Figure Page
- Back to All Figure Page
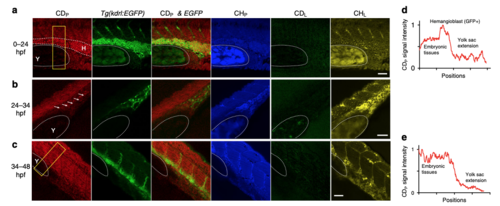
DO-SRS microscopy, in combination with fluorescent labeling, tracks lineage-specific metabolism during zebrafish embryogenesis. a–c SRS microscopic signal and the colocalization with fluorescence from Tg(kdrl::EGFP) reporter in zebrafish embryos that were incubated in egg solution containing 20% D2O from 0 to 24 hpf, from 24 to 34 hpf, or from 34 to 48 hpf. Dashed curves outline the yolk sac extension (labeled as Y) and the GFP-positive hemangioblast (labeled as H) that has strong CDP signal. Arrows point to the GFP-positive cells that are likely differentiating angioblasts in b. d, e Intensity profiles that quantify the CDP signal within the yellow rectangle for 0–24 and 34–48 hpf probing, respectively. x axis shows the position along the length of the box from top to bottom, and y axis shows the average intensity across the width of the box. Scale bar = 20 μm |