
Fig. 2
- ID
- ZDB-FIG-190522-10
- Publication
- Radic-Sarikas et al., 2017 - Lapatinib potentiates cytotoxicity of YM155 in neuroblastoma via inhibition of the ABCB1 efflux transporter
- Other Figures
- All Figure Page
- Back to All Figure Page
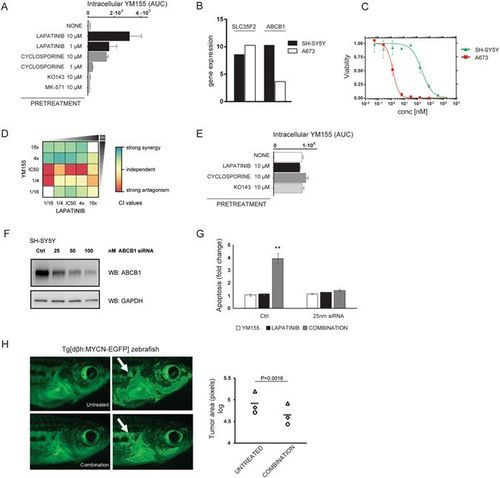
Synergistic effect is a consequence of a blocked efflux of YM155 by lapatinib in vitro. The anti-tumor effect of the combination is confirmed in an in vivo model. (A) Multiple-reaction monitoring assay in the SH-SY5Y neuroblastoma cells. Lapatinib inhibits the ABCB1 transporter and allows higher intracellular concentration of YM155. Area under the curve (AUC) corresponds to intracellular YM155 levels. Cyclosporine, MK-571 and KO143 are inhibitors of ABCB1, ABCC1 and ABCG2 transporters, (respectively). Data are the mean ± s.d. of triplicates. (B) Comparison of mRNA expression profiles of SLC35F2 and ABCB1 available in CCLE32 between SH-SY5Y and A673 cells. (C) Dose response curves of the effects of YM155 on the viability of SH-SY5Y (green) and A673 cells (red). (D) Heatmap of CI values in the combination matrix of YM155 and lapatinib in A673 cells. Data represent the mean of triplicates. (E) Multiple-reaction monitoring assay in A673 cells. Area under the curve (AUC) corresponds to intracellular YM155 levels. Cyclosporine and KO143 are inhibitors of ABCB1 and ABCG2 transporters, (respectively). Data are the mean ± s.d. of triplicates. (F) Efficiency of ABCB1 knock down after 24 hours. (G) Combined effect of ABCB1 knockdown and YM155 and/or lapatinib treatment on apoptosis of SH-SY5Y cells. Apoptosis was measured in SH-SY5Y cells which were transfected with control siRNA or siRNA against ABCB1 (25 nM); and treated with DMSO, 1 μM lapatinib and/or 15 nM YM155 for 48 hours. Percentages of cell death were used to calculate the fold changes in apoptosis of siRNA transfected and drug treated cells compared to untreated siRNA transfected cells. (Mean ± SEM, n = 3, **P < 0.01, ANOVA). (H) Analysis of neuroblastoma growth in Tg[dβh:MYCN-EGFP] zebrafish, expressing MYCN-EGFP under the control of dopamine-β-hydroxylase promoter. Fish were treated with lapatinib and YM155 (2 µM and 6.5 nM, respectively) for 7 days. Zebrafish were imaged before and after treatment with the same settings. The fluorescent area behind gills corresponding to tumors (white arrow) were measured by using ImageJ (representative images of three independent experiments, n = 3). A quantitation of the results is shown in the graph, where each symbol represents a fish (P = 0.0016, paired t test).
|
| Fish: | |
|---|---|
| Condition: | |
| Observed In: | |
| Stage: | Adult |