|
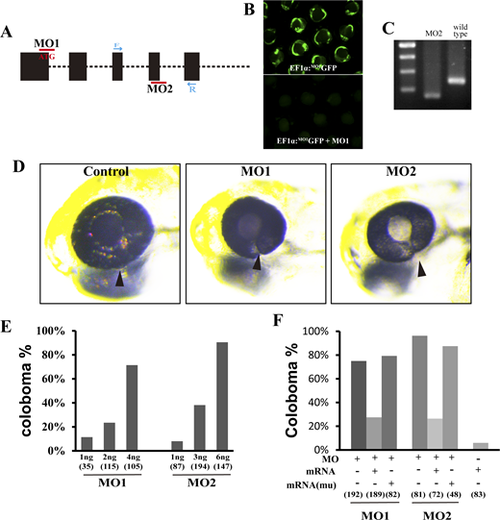
afap1l2 is required for proper closure of the OF in zebrafish. (A) The diagram of partial zebrafish afap1l2 gene structure illustrates the targeting positions of MO1 and MO2 and the locations of primers for splicing variant RT-PCR. (B) MO1 knockdown efficacy reporter assay showing that coinjecting MO1 with the reporter plasmid blocked GFP expression. (C) MO2 knockdown efficiency RT-PCR assay showing that MO2 knockdown resulted in shorter amplicons lacking exon 4. (D) Eye images of control and afap1l2 morphants. Arrowheads point to the OF. (E) Quantification of percentage of coloboma incidences in afap1l2-morphant zebrafish shows that the penetrance of both afap1l2 MOs exhibited dosage dependency. (F) Quantification of incidences of coloboma phenotype of afap1l2 mRNA rescue experiments. mRNA (mu): mutant form of afap1l2 mRNA. Numbers at the bottom of each column in (E, F) denote the number of zebrafish used in each experimental group.
|