|
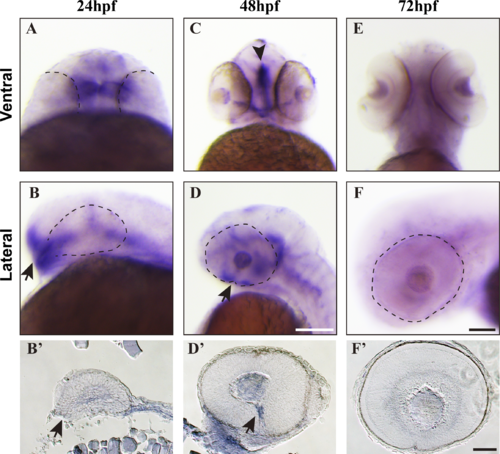
Zebrafish afap1l2 is specifically expressed at the closing OF. Whole-mount RNA ISH of afap1l2 in zebrafish embryos at 24 hpf (A, B, B'), 48 hpf (C, D, D'), and 72 hpf (E, F, F'). (A) A frontal view of a zebrafish head at 24 hpf. (C, E) Lateral views of zebrafish heads. (B, F) Ventral views of zebrafish heads. (B', F') Sagittal section images of zebrafish embryonic heads after afap1l2 whole-mount ISH. Arrows in (B, B', D, D') point to the OF. The arrowhead in (C) points to the midline signal of afap1l2. Scale bars are all 100 μm. The scale bar in (D) applies to (A–D); the scale bar in (F) applies to (E, F); and the scale bar in (F') applies to (B'–F').
|