
Fig. 1
- ID
- ZDB-FIG-190108-37
- Publication
- Krishnakumar et al., 2018 - Functional equivalence of germ plasm organizers
- Other Figures
- All Figure Page
- Back to All Figure Page
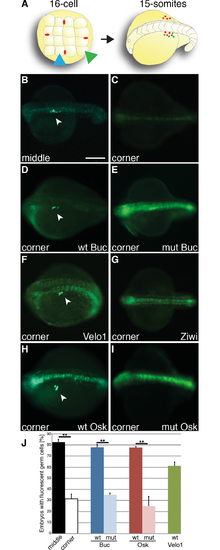
(A) Scheme of germ cell induction assay. Left panel: Animal view of a 16-cell embryo injected with PGC-reporter into a middle blastomere (blue arrowhead) containing endogenous germ plasm (red dots) or into a somatic cell (corner blastomere; green arrowhead). Right panel: Oblique, dorsal view of a 15-somite stage embryo (18 hours post fertilization, hpf), anterior to the left. Fluorescent germ cells (white arrowhead) emerge by targeting the reporter to a PGC or transforming a somatic cell into a PGC. (B, C) Live 18 hpf embryo after injection of PGC-reporter into a middle (B; 83±2.4%; n = 70) or corner blastomere (C; 31±4.5%; n = 70; p = 0.005). As previously shown, the gfp-nos3’UTR reporter also frequently labeled the midline at this stage [33]. (D, E) Wild-type Buc (aa1-639) reprograms the somatic corner blastomere to the germline (D; wt = 78±2.6%; n = 71), but not mutant Buc (Bucp43). Bucp43 mRNA sequence is identical to wt, but carries a point mutation (Y362STOP) [17] (E; mut = 35±1.6%; n = 68; p = 0.001). (F, G) Xenopus Velo1 acts as a functional homolog (F; 61±3.5%; n = 41) but not zebrafish Ziwi (G). (H, I) Drosophila sOsk induces germ cell formation (H; wt = 78±1.1%; n = 81), but not mutant sOsk084 (aa139-254) (I; mut = 25±8.7%; n = 62; p = 0.01). Scale bar (B-I): 200 μm. (J) Quantification of injection results (three independent experiments for each RNA). Error bars represent standard deviation of the mean. Student’s t-test; P-value: **<0.01. |