
Fig. 4
- ID
- ZDB-FIG-181127-48
- Publication
- Acosta et al., 2018 - Neuronal cell culture from transgenic zebrafish models of neurodegenerative disease
- Other Figures
- All Figure Page
- Back to All Figure Page
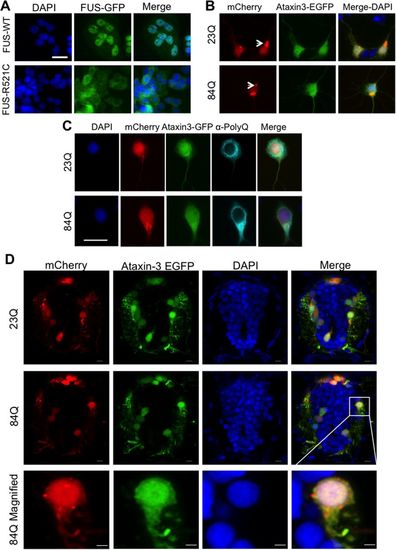
Cultured cells derived from transgenic zebrafish larvae expressing neurodegenerative disease associated proteins FUS or ataxin-3. (A) In cells cultured from mutant human FUS-GFP (FUS-R521C) zebrafish the FUS-GFP protein was mislocalized to the cytosol, whereas it remained predominantly nuclear in cells cultured from wild-type FUS-GFP zebrafish. (B) Cells cultured from double transgenic zebrafish expressing mCherry (red) and EGFP-ataxin-3-23Q/84Q (green) showed no obvious difference in fluorescent protein distribution in cells expressing non-pathogenic EGFP-ataxin-3-23Q and pathogenic EGFP-ataxin-3-84Q. Aggregates of mCherry-positive protein (arrows) were present in some neurons (Jakobs et al., 2000). (C) Immunolabeling cell cultures with anti-polyQ (pale blue) demonstrated cytosolic distribution of the ataxin-3 protein in cells expressing either EGFP-ataxin-3-23Q or pathogenic EGFP-ataxin-3-84Q. Scale bars: 10 µm. (D) Cross-sections of the spinal cord of 3 dpf transgenic SCA3 zebrafish revealed a similar expression pattern of EGFP-ataxin-3 and mCherry to that seen in the cell cultures. Scale bars: 5 µm. |