
Fig. 5
- ID
- ZDB-FIG-181030-7
- Publication
- Mansour et al., 2018 - JDP2: An oncogenic bZIP transcription factor in T cell acute lymphoblastic leukemia
- Other Figures
- All Figure Page
- Back to All Figure Page
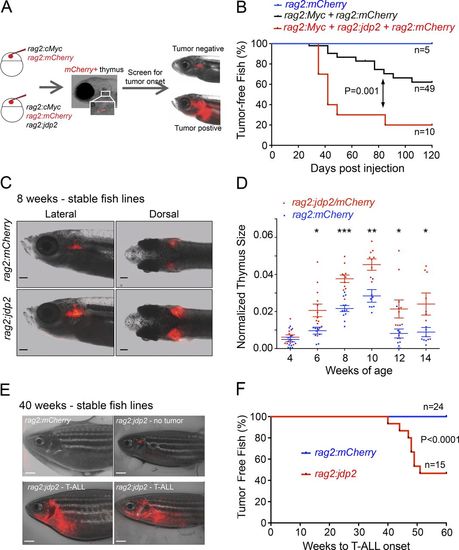
Jdp2collaborates with Myc and can initiate T-ALL in a zebrafish model. (A) Schematic showing the coinjection strategy used to identify Myc collaborating genes in first generation mosaic transgenic zebrafish. (B) Kaplan–Meier curves showing tumor onset in first-generation mosaic zebrafish coinjected with constructs expressing rag2:Myc + rag2:jdp2 + rag2:mCherry (red line), versus rag2:Myc + rag2:mCherry versus (black line), versus rag2:mCherry alone (blue line). (C) Representative fluorescent images of thymuses from 8-wk-old stable transgenic zebrafish expressing Tg(rag2:mCherry) and Tg(rag2:jdp2). Bars, 1 mm. (D) Quantification of thymus size from Tg(rag2:mCherry) and Tg(rag2:jdp2) assessed by fluorescent microscopy biweekly from 4 to 14 wk of age. To account for intervariation in fish size, thymus size was normalized to head size. * P<0.05; ** P<0.005; *** P<0.0005. Data points represent the mean ± standard error of the mean. (E) Representative fluorescent microscopy images from a 40-wk-old Tg(rag2:mCherry), and three Tg(rag2:jdp2) zebrafish. Bars, 1 mm. (F) Kaplan–Meier curves showing tumor onset in stable Mendelian transgenic zebrafish expressing Tg(rag2:mCherry; red line) and Tg(rag2:jdp2; blue line). |
| Fish: | |
|---|---|
| Observed In: | |
| Stage Range: | Days 21-29 to Adult |