
Fig. S3
- ID
- ZDB-FIG-181018-24
- Publication
- Burguera et al., 2017 - Evolutionary recruitment of flexible Esrp-dependent splicing programs into diverse embryonic morphogenetic processes
- Other Figures
- All Figure Page
- Back to All Figure Page
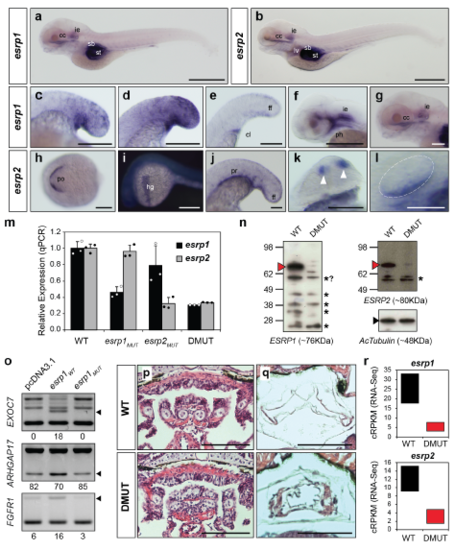
Developmental expression and impact of Esrp genes in zebrafish. (a-l) Additional details of WMISH for esrp1 and esrp2 in zebrafish embryos. (a,b) Similar expression of esrp1 and esrp2 was detected in 5dpf embryos in inner ear (ie) and craniofacial cartilaginous (cc) tissue. Signal was also observed in stomach (st) and swim bladder (sb), although non-specific staining of those hollow organs by NBT/BCIP precipitation could not be ruled out. esrp2 was additionally found in the liver (lv). (c-e) Broad expression of esrp1 in the tail bud ectoderm was maintained at 18hpf (c), reached its highest intensity by 20hpf (d), and became restricted to the median fin fold (ff) by 24hpf (e), when it was also observed in cloaca (cl) tissue. (f) 48hpf embryo heads showed expression of esrp1 predominantly in pharynx (ph) and inner ear (ie). (g) Detail of esrp1 expression in the head of 5dpf embryos in craniofacial cartilage (cc) and inner ear (ie). (h-l) esrp2 expression was also detected in a few territories where esrp1 was not observed, including the polster (po) at 14hpf (h), that later develops into the hatching gland (hg) by 24hpf (i), and in the pronephros (pr) (j); it shared expression with esrp1 in structures such as olfactory placode (white arrowheads) (k, 24hpf) and inner ear ventral epithelium (l, 32hpf). (m) Quantitative PCR (qPCR) assays showing the levels of expression of esrp1 and esrp2 genes in pools of 5dpf embryos with different genotypes (wild type [WT], esrp1 and esrp2 single mutants and double mutants [DMUT]). Error bars correspond to standard deviations of three technical replicates. (n) Western blot assays showing detection of ESRP1 and ESRP2 full-length proteins (red arrow heads) in 5dpf in WT, but not DMUT, embryos. Asterisks mark shorter bands that most likely correspond to unspecific signal based on size. (o) Ectopic expression of WT, but not mutant, zebrafish esrp1 transcripts in human 293T cells produced splicing changes in endogenous ESRP1 human targets. Black arrowheads indicate Esrp-enhanced isoforms. (p,q) Phenotypic comparison of transversal sections stained with hematoxylin and eosin from 6dpf embryos shows impaired development of visceral skeleton (p) and swim bladder (q). (r) Expression of esrp1 and esrp2 in 5dpf embryos quantified by RNA-seq using the cRPKM metric shows a clear reduction in the steady-state mRNA levels of both genes in DMUT embryos. Boxes represent the range of expression in the two replicates. Scale bars: 2 mm (a, b, i), 500 μm (d-h, j, k), 250 μm (l), 100 μm (p,q). |
| Genes: | |
|---|---|
| Antibodies: | |
| Fish: | |
| Anatomical Terms: | |
| Stage Range: | 10-13 somites to Day 5 |
| Fish: | |
|---|---|
| Observed In: | |
| Stage Range: | Day 5 to Day 6 |