
Fig. S1
- ID
- ZDB-FIG-181002-10
- Publication
- Rosch et al., 2018 - Calcium imaging and dynamic causal modelling reveal brain-wide changes in effective connectivity and synaptic dynamics during epileptic seizures
- Other Figures
- All Figure Page
- Back to All Figure Page
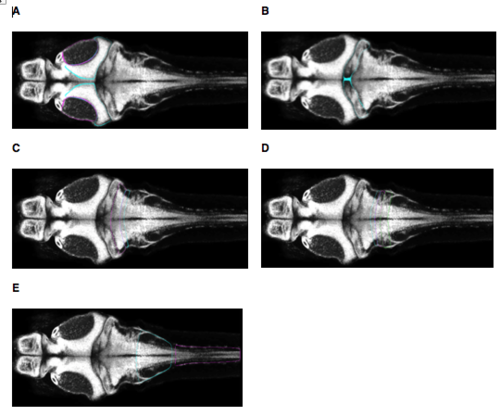
Atlas regions corresponding to the anatomical segmentation used in our analysis (all images at z = -90. (A) ‘Tectum’ corresponds to Z Brain regions Tectum Stratum Periventriculare and Tectum Neuropil. (B) ‘Cerebellum’ corresponds to Z Brain region Cerebellum. (C) ‘Rostral Hindbrain’ corresponds to Z Brain regions Rhombomere 2 and Rhombomere 3. (D) ‘Mid Hindbrain’ corresponds to Z Brain region Rhombomere 4, Rhombomere 5, and Rhombomere 6. (E) ‘Caudal Hindbrain / Rostral Spinal Cord’ corresponds to Z Brain regions Rhombomere 7, and Spinal Cord. Images are taken from https://engertlab.fas.harvard.edu/Z-Brain [accessed 18/05/2018]. |