
FIGURE
Fig. 3
- ID
- ZDB-FIG-180927-56
- Publication
- Omar et al., 2017 - Optical imaging of post-embryonic zebrafish using multi orientation raster scan optoacoustic mesoscopy
- Other Figures
- All Figure Page
- Back to All Figure Page
Fig. 3
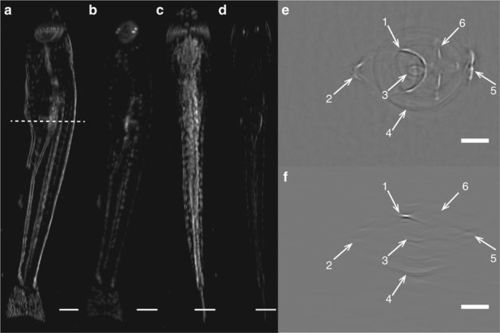
Comparison of the images generated using MORSOM and RSOM. (a) Top view MIP from MORSOM. (b) Top view MIP from RSOM. (c) Side view MIP from MORSOM. (d) Side view MIP from RSOM. (e) Cross section through the Zebrafish taken from MORSOM at the position indicated by the broken line in a. (f) Same cross section from RSOM. The arrows point to the similar features shown in e and f. In the MORSOM case, many features are either complete or do not even appear in f (Scale bars=a–d 500 μm; e,f 250 μm, 0.3% of the pixels in a–d were saturated to improve the visibility of the RSOM images). |
Expression Data
Expression Detail
Antibody Labeling
Phenotype Data
Phenotype Detail
Acknowledgments
This image is the copyrighted work of the attributed author or publisher, and
ZFIN has permission only to display this image to its users.
Additional permissions should be obtained from the applicable author or publisher of the image.
Full text @ Light Sci Appl