
Fig. 3
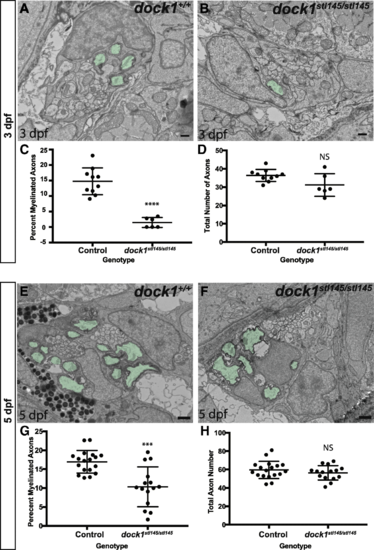
PNS myelination is significantly reduced in stl145 mutants. a, b) TEM of a cross-section of the PLLn at 3 dpf. Myelinated axons are pseudocolored in green. Scale bars = 500 nm. a) Axons in wild-type PLLn begin to be myelinated while b) dock1stl145 homozygous mutant PLLn exhibits fewer myelination of axons. c) Quantification of the percent myelinated axons shows a significant difference between control (n = 6 animals, 10 nerves) and dock1stl145 mutants (n = 4 animals, 6 nerves). d) Quantification of the total number of axons (NS, p = 0.0983). e, f) Quantification of a cross-section of the PLLn at 5 dpf. Myelinated axons are pseudocolored in green. Scale bars = 500 nm. e) The PLLn of a wild-type larva contains numerous myelinated axons whereas f) a dock1stl145 homozygous mutant PLLn contains fewer myelinated axons. g) Quantification of the percent myelinated axons shows a significant difference between control (n = 11 animals, 18 nerves) and dock1stl145 mutants (n = 9 animals, 15 nerves). h) Quantification of the total number of axons (NS, p = 0.3031). Bars represent means ± SD. ***p < 0.001, ****p < 0.0001, unpaired t Test with Welch’s correction |
| Fish: | |
|---|---|
| Observed In: | |
| Stage Range: | Protruding-mouth to Day 5 |