
Fig. 1
- ID
- ZDB-FIG-180911-32
- Publication
- Muralidharan et al., 2018 - Retinal Wnt signaling defect in a zebrafish fetal alcohol spectrum disorder model
- Other Figures
- All Figure Page
- Back to All Figure Page
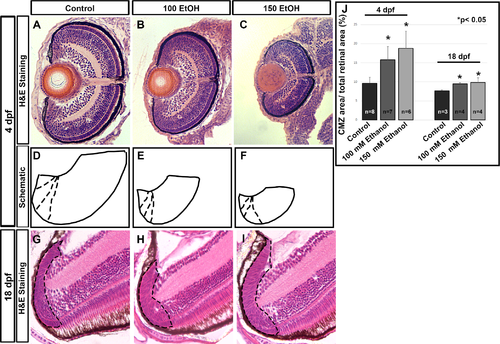
Early ethanol exposure altered CMZ composition. (A-C) H&E staining of control (A), 100 mM ethanol (B), and 150 mM ethanol treated larvae (C) show persistent defects at 4 dpf. (D-F) Schematic drawn of the ventral half of the retina in proportion to the histology sections at 4 dpf (A-C). The solid line indicates the retinal area ending at the optic nerve and the outer most layer of the retina. Dashed lines indicate the various parts of the CMZ as can be distinguished by the nuclear morphology. (G-I) H&E staining of control (G), 100 mM ethanol (H), and 150 mM ethanol treated fish (I) show persistent defects at 18 dpf. The ethanol treated fish (H, I) showing slightly expanded CMZ due to ethanol exposure. Black dashed lines indicate the CMZ area, which is demarcated based on retinal lamination and cell morphology. (J) Ratio of CMZ area to the retinal area showing an increase in CMZ in proportion to the retina persistently at 4 and 18 dpf. Images show rostral at top, lateral at left. Error bars indicate standard deviation. ‘*’ indicates statistical significance in comparison to control embryos (p<0.05). |
| Fish: | |
|---|---|
| Condition: | |
| Observed In: | |
| Stage Range: | Day 4 to Days 14-20 |