
- Title
-
Retinal Wnt signaling defect in a zebrafish fetal alcohol spectrum disorder model
- Authors
- Muralidharan, P., Sarmah, S., Marrs, J.A.
- Source
- Full text @ PLoS One
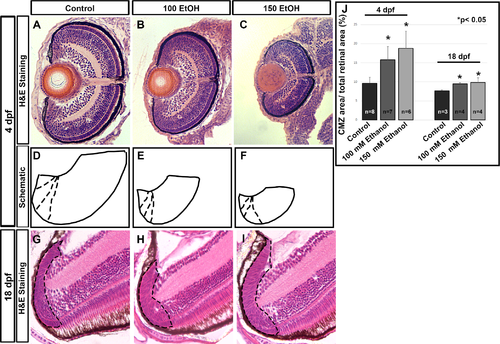
Early ethanol exposure altered CMZ composition. (A-C) H&E staining of control (A), 100 mM ethanol (B), and 150 mM ethanol treated larvae (C) show persistent defects at 4 dpf. (D-F) Schematic drawn of the ventral half of the retina in proportion to the histology sections at 4 dpf (A-C). The solid line indicates the retinal area ending at the optic nerve and the outer most layer of the retina. Dashed lines indicate the various parts of the CMZ as can be distinguished by the nuclear morphology. (G-I) H&E staining of control (G), 100 mM ethanol (H), and 150 mM ethanol treated fish (I) show persistent defects at 18 dpf. The ethanol treated fish (H, I) showing slightly expanded CMZ due to ethanol exposure. Black dashed lines indicate the CMZ area, which is demarcated based on retinal lamination and cell morphology. (J) Ratio of CMZ area to the retinal area showing an increase in CMZ in proportion to the retina persistently at 4 and 18 dpf. Images show rostral at top, lateral at left. Error bars indicate standard deviation. ‘*’ indicates statistical significance in comparison to control embryos (p<0.05). PHENOTYPE:
|
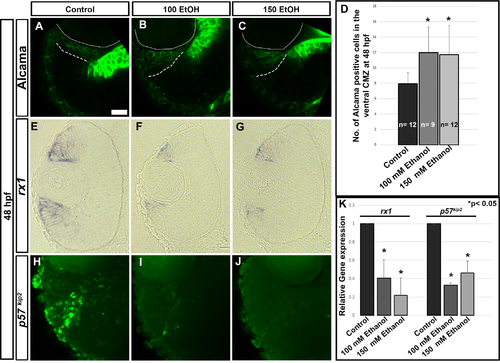
Cellular changes caused in the CMZ due to ethanol exposure. (A-C) Alcama staining of ethanol treated embryos (B, C) showed expansion in comparison to control embryos (A) at 48 hpf in peripheral CMZ. Solid while lines indicate the lens and dashed lines indicate expression domain of Alcama. (D) Quantification of Alcama positive cells in the ventral CMZ at 48 hpf. The number of Alcama positive cells in a single optic nerve containing confocal section of the retina was counted. (E-G) rx1 ISH sections showed reduced expression after ethanol treatment in peripheral CMZ. (H-J) p57kip2 FISH experiment showed reduced expression in central CMZ. Images show rostral at top, lateral at left. (K) qPCR showed reduced transcript levels of rx1 and p57kip2 genes at 72 hpf after ethanol treatment in comparison to control retinas. Fold changes in gene expression was calculated using comparative CT method (ΔΔCT). Error bars indicate standard deviation. ‘*’ indicates statistical significance in comparison to control embryos (p<0.05). Scale bar = 10 μm. |
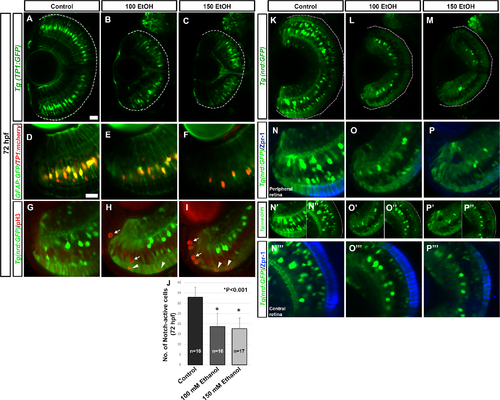
Effect of ethanol on MGC and central retina precursor cell populations. (A-C) Transgenic line Tg(TP1:GFP) showed reduced Notch-active cells after ethanol exposure at 72 hpf. (D-F) Double transgenic line Tg(gfap:GFP) and Tg(TP1:mCherry) showed reduced Notch- and GFAP- double positive cells after ethanol exposure at 72 hpf. (G-I) PhosphoH3 immunostaining on Tg(nrd:GFP) larvae showed an increased number of mitotically active cells in the ONL and INL, many of which co-labeled with neurod- positive cells. (J) Quantification of Notch-active cells per optic-nerve containing optical section of the retina using Tg(TP1:mCherry) showed a significant decrease after ethanol treatment in comparison to control fish. A single optic nerve-containing optical section of 72 hpf control and ethanol treated larvae was used. (K-M) Tg(nrd:GFP) larvae showed reduced expression of neurod after ethanol exposure at 72 hpf. (N-P”‘) zpr-1 immunostaining on Tg(nrd:GFP) larvae showed fewer zpr-1 positive cells in the peripheral retina after ethanol exposure.(N-P). In the central retina, zpr-1-positive cells were double labeled with neurod after ethanol exposure (N”‘-P”‘) compared to Tg(nrd:GFP) expression showing expanded neurod expression in the ONL (N’, N”, O’, O”, P’, P”). White dashed lines indicate retinal pigmented epithelium (RPE). Images show rostral at top, lateral at left. Error bars indicate standard deviation. ‘*’ indicates statistical significance in comparison to control embryos (p<0.05). Scale bar = 20 μm for panels A-C and K-M. Scale bar = 10 μm for panels D-P”‘. PHENOTYPE:
|

Effect of ethanol exposure on Wnt signaling, and Notch and proneural gene expression. (A-C) Tg(Tcf/Lef-miniP:dGFP) fish showed Wnt-active cells (green) in the peripheral CMZ labeled with Alcama (red). (D-F) axin2 ISH showed decreased axin2 expression in peripheral CMZ after ethanol exposure. (G-I) her6 ISH sections showed an expansion of her6 expression in the CMZ after ethanol treatment at 48hpf. Boxed regions in ISH sections highlighting the peripheral retina were magnified in the insets for each image. (J-L) 3D rendition of Tg(TP1:GFP) fish showed expanded Notch-active cells in the CMZ. (M-O) Central CMZ region of Tg(nrd:GFP) fish showed increased neurod-positive cells after ethanol treatment at 72 hpf. (P) Quantification of Wnt+/Alcama+ and Wnt-/Alcama + cells in the peripheral CMZ. Solid lines demarcate the CMZ from the neural retina based on retinal lamination using TO-PRO-3 staining as indicated (Q, yellow). Dashed lines (white, brown and yellow) indicate RPE of the retina. Numbers of cells were counted in a single optic-nerve containing confocal optical section in the ventral CMZ. Images show rostral at top, lateral at left. Error bars indicate standard deviation. ‘*’ indicates statistical significance in comparison to control embryos (p<0.05). Scale bar = 10 μm for panels A-C and J-O. EXPRESSION / LABELING:
PHENOTYPE:
|

RA and FA co-supplementation rescue Wnt signaling. Alcama staining on Tg(Tcf/lef-miniP:dGFP) fish showed that ethanol treatment reduced the number of Wnt+/Alcama+ cells in the peripheral CMZ. Control and ethanol treated embryos in this experiment appeared identical to those shown in Fig 4A–4C and were left out for brevity. (A-F) RA co-supplementation could rescue Wnt+/Alcama+ cells (A-C); FA co-supplementation could also rescue Wnt+/Alcama+ cells in the CMZ particularly in 100 mM Ethanol + FA treated fish (D-F). (G) Quantification of Wnt+/Alcama+ cells in the peripheral CMZ showed significant reduction after ethanol treatment, which was rescued by RA and FA co-supplementation. Numbers of cells were counted in a single optic-nerve containing confocal optical section in the ventral CMZ. Images show rostral at top, lateral at left. Error bars indicate standard deviation. ‘**’ indicates statistical significance in comparison to control embryos (p<0.01). ‘*’ indicates statistical significance in comparison to control embryos (p<0.05). ‘a’ indicates statistical significance in comparison to 100 mM ethanol embryos (p<0.05). ‘b’ indicates statistical significance in comparison to 150 mM ethanol embryos (p<0.05). Scale bar = 10 μm for panels A-F. PHENOTYPE:
|

RA, but not FA, co-supplementation induces proliferation. (A-I) PhosphoH3 (red) staining of Tg(TP1:gfp), (green cells) larvae showed that ethanol exposure induced proliferation in the CMZ, INL and ONL. (A’-I’) 3D rendition of phosphoH3 staining in the peripheral retinal region showed the increase in proliferation in ethanol treated larvae (B’, C’) which was increased after RA treatment (D’,E’, F’) and rescued after FA co-supplementation (G’, H’, I’). (J) Quantification of mCherry-positive (Notch-active cells) in the retina showed a significant rescue of notch signaling after both RA and FA co-supplementation. (K) Quantification of phosphoH3-positive cells per unit area at 72 hpf showed statistically significant increase in phosphoH3-positive cells in after ethanol treatment which was rescued after FA co-supplementation. Numbers of cells were counted in a single optic-nerve containing confocal optical section in the ventral CMZ. White dashed lines indicate RPE of the retina. Images show rostral at top, lateral at left. Error bars indicate standard deviation. ‘*’ indicates statistical significance in comparison to control embryos (p<0.05). ‘a’ indicates statistical significance in comparison to 100 mM ethanol embryos (p<0.05). ‘b’ indicates statistical significance in comparison to 150 mM ethanol embryos (p<0.05). Scale bar = 20 μm for panels A-I. Scale bar = 10 μm for A’-I’. |

Wnt agonist treatment rescues ethanol-induced retinal cell differentiation defects. (A-C) Treatment with 350 nM GSK3β inhibitor (LSN 2105786) showed a rescue of Wnt+ cells in the peripheral CMZ, which were reduced after ethanol treatment. Control and ethanol treated embryos in this experiment appeared identical to those shown in Fig 4A–4C and were left out for brevity. (D) Quantification of Wnt+/Alcama+ and Wnt-/Alcama+ cells in the peripheral CMZ. (E-J) Treatment with LSN 2105786 on Tg(TP1:GFP) fish showed rescue of Notch signaling after LSN 2105786 treatment. Ethanol treated fish show reduced notch-activity (green) and photoreceptor terminal differentiation marker expression (zpr-1, red), which was restored by LSN 2105786 treatment. (K) Quantification of mCherry-positive, Notch-active cells per optic nerve containing optical section, in the retina showed a significant rescue of notch signaling after LSN 2105786 treatment. (L) Quantification of phosphoH3-positive cells in the retina showed a significant rescue of cell proliferation response after LSN 2105786 treatment at 72 hpf. (M) Quantification of total zpr-1 intensity in the ONL of the retina showed a significant decrease in photoreceptor marker expression after ethanol treatment (2–24 hpf) and subsequent rescue by LSN 2105786 treatment from 32–48 hpf. 100E+ LSN 2105786, and 150E+ LSN 2105786 indicates 100 mM and 150 mM ethanol exposed embryos treated with LSN 2105786, respectively. Images show rostral at top, lateral at left. Error bars indicate standard deviation. ‘**’ indicates statistical significance in comparison to control embryos (p<0.01). ‘*’ indicates statistical significance in comparison to control embryos (p<0.05). ‘a’ indicates statistical significance in comparison to 100 mM ethanol embryos (p<0.05). ‘b’ indicates statistical significance in comparison to 150 mM ethanol embryos (p<0.05). Scale bar = 10 μm for panels A-C. Scale bar = 10 μm for panels E-J. EXPRESSION / LABELING:
PHENOTYPE:
|