|
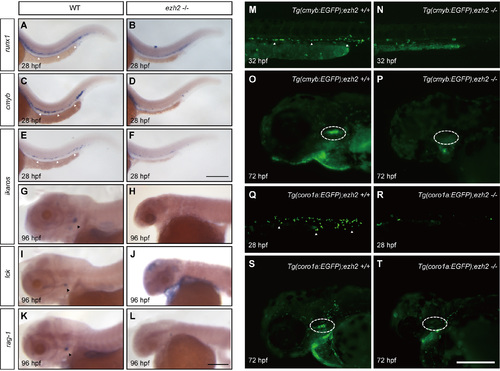
Definitive hematopoiesis is disrupted in ezh2–/– mutant zebrafish. (A–L) In situ hybridization of WT sibling (A, C, E, G, I and K) and ezh2–/– mutant embryos or larvae (B, D, F, G, J and L) using probes of runx1 (A, B), cmyb (C, D), ikaros (E, H), lck (I, J), rag-1 (K, L) at 28 hpf (A, F) and 96 hpf (G, L), respectively. White arrowheads indicate ICM in A, C and E and black arrowheads the thymus in G, I and K. Scale bar, 0.25 mm. (M–P) Images of cmyb:eGFP cells in wild-type (M, O) and ezh2–/– mutant (N, P) fish at 32 hpf (M, N) and 72 hpf (O, P). (Q–T) Images of coro1a:eGFP cells in wild-type (Q, S) and ezh2–/– mutant (R, T) fish at 28 hpf (Q, R) and 72 hpf (S, T). White arrowheads indicate ICM in M, N, Q and R and dashed circle the thymus in O, P, S and T. Scale bar in (M–T), 0.25 mm. All images shown are lateral view, anterior to left.
|