
Fig. 2
- ID
- ZDB-FIG-180716-1
- Publication
- Monesson-Olson et al., 2018 - Expression of the eight GABAA receptor α subunits in the developing zebrafish central nervous system
- Other Figures
- All Figure Page
- Back to All Figure Page
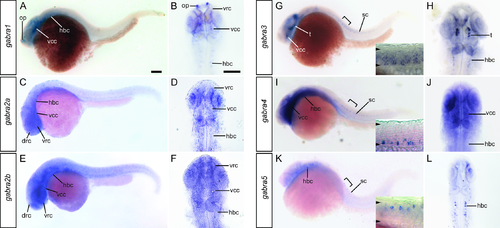
Expression of GABAA α subunits at 24 hpf. gabra1 (A, B), gabra2a (C, D), gabra2b (E, F), gabra3 (G, H), gabra4 (I, J), and gabra5 (K, L) were detected at this time point. Whole-mount lateral (A, C, E, G, I, K) views are shown along with dorsal views of the head (B, D, F, H, J, L). The scale bar (A) is 0.1 mm. The brackets in G, I, and K indicate the regions shown at higher magnification in the corresponding insets. The arrowheads within the insets indicate the dorsal and ventral boundaries of the spinal cord. Abbreviations: drc, dorsal rostral cluster; hbc, hindbrain cluster; op, olfactory placode; SC, spinal cord; t, tegmentum; vcc, ventral caudal cluster; vrc, ventral rostral cluster. |
| Genes: | |
|---|---|
| Fish: | |
| Anatomical Terms: | |
| Stage: | Prim-5 |