
Fig. 6
- ID
- ZDB-FIG-180712-45
- Publication
- Shibata et al., 2018 - Heterogeneous fates and dynamic rearrangement of regenerative epidermis-derived cells during zebrafish fin regeneration
- Other Figures
- All Figure Page
- Back to All Figure Page
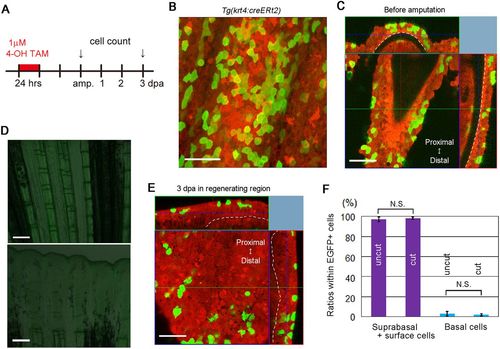
Fate analysis of suprabasal and surface epidermal cells. (A) Experimental procedure used to conduct the fate analysis of surface and suprabasal cells. (B) A representative z-stack image of an uncut fin from a Tg(krt4:creERt2;Olactb:loxP-dsred2-loxP-egfp) in which the non-basal epidermal cells were labelled by treatment with TAM. Scale bar: 50 µm. A number of Cre-labelled cells are seen 2 days after TAM treatment. (C) A confocal optical section of the Tg fin shown in B. The dotted lines indicate the basement membranes of the epidermis. The top and right images are tomographic images reconstituted from the z-stack data. The Cre-labelled cells are mostly seen in the suprabasal and surface cell layers. Scale bar: 50 µm. (D) Cre-mediated recombination without TAM treatment in an uncut fin (top) and a regenerating fin (bottom) at 3 dpa from Tg(krt4:creERt2;Olactb:loxP-dsred2-loxP-egfp). EGFP+ cells were not observed (n=3 for both groups). Scale bars: 200 µm. (E) A confocal optical section of a 3 dpa fin from Tg(krt4:creERt2) that was amputated 2 days after TAM treatment. The top and right images are tomographic images reconstituted from the z-stack data. The dotted lines indicate the basement membranes of the epidermis. The progeny of the Cre-labelled non-basal cells localized to the suprabasal and surface cell layers. Scale bar: 50 µm. (F) Quantification of the ratios of respective epidermal cell types within Cre-labelled EGFP+ cells, before and after fin amputation. Although only a small fraction of labelled cells was seen in the basal epidermal layer, the ratio of basal cells within EGFP+ cells did not change, comparing before and after amputation, suggesting that most of the suprabasal and/or surface cells maintained their identities and did not de-differentiate into the basal cells during regeneration. Data are mean±s.e.m.; Student's t-test (two-tailed) was performed to assess statistical significance (n=27 images from eight uncut fins and 28 images from eight regenerating fins, respectively). N.S., not significant (P=0.69). |