
Fig. 5
- ID
- ZDB-FIG-180712-44
- Publication
- Shibata et al., 2018 - Heterogeneous fates and dynamic rearrangement of regenerative epidermis-derived cells during zebrafish fin regeneration
- Other Figures
- All Figure Page
- Back to All Figure Page
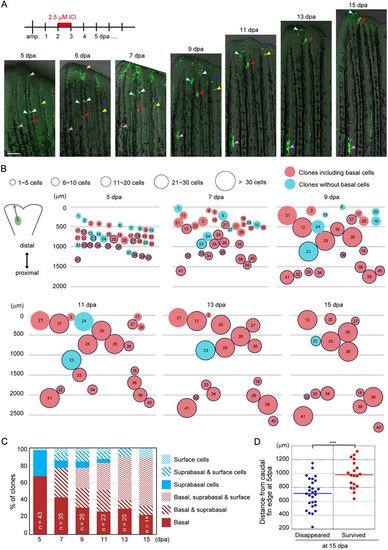
Fate analysis of single fn1b-expressed RE cells. (A) Single clone tracking of the progeny of fn1b-expressed RE cells labelled by Cre-loxP recombination in the Tg(fn1b:creERt2;Olactb:loxP-dsred2-loxP-egfp). Labelling was performed using 2.5 µM ICI at 2-3 dpa. The coloured arrowheads indicate the respective positions of representative clones. Scale bar: 200 µm. The position of the purple arrowheads relative to the amputation site is approximately constant. Clones of the Cre-labelled cells gradually move in the caudal direction and disappear at the fin edge. (B) Schematic illustration of the data from the single-clone tracking analysis. Distances of clones from the caudal edge, sizes of the clones and inclusion of basal cells are schematically expressed by the positions, sizes and colours of the respective circles. n=41 clones from 10 zebrafish. Many of the clones without basal cells and/or located in distal regions disappeared by 15 dpa. An increase in cell number does not depend on the position of the clones, but rather occurs at random. The thick blue outline of the circles indicates the clones that survived beyond 15 dpa. (C) Ratios of individual epidermal clone types grouped by cell type composition. The ratios are expressed as percentage of cells among the surviving clones at each stage. At 5 dpa, most clones derived from the RE contained only basal or suprabasal cells. The suprabasal clones produced the surface cells and finally became the clones containing only surface cells at 15 dpa, whereas the basal clones produced the suprabasal and surface cells to become clones containing all three cell types. (D) Beeswarm plot of the respective positions of clones from the caudal fin tip at 5 dpa. The surviving clones at 15 dpa were originally located in the proximal regions at 5 dpa, whereas a significant number of distally located clones at 5 dpa disappeared at 15 dpa (***P=0.0000418). n=19 (surviving clones) and 29 (disappearing clones). Student's t-test (two-tailed) was performed to assess statistical significance. Every result is plotted; horizontal bars indicate the mean. |