
Fig. 8
- ID
- ZDB-FIG-180705-59
- Publication
- Williams et al., 2018 - Gon4l regulates notochord boundary formation and cell polarity underlying axis extension by repressing adhesion genes
- Other Figures
- All Figure Page
- Back to All Figure Page
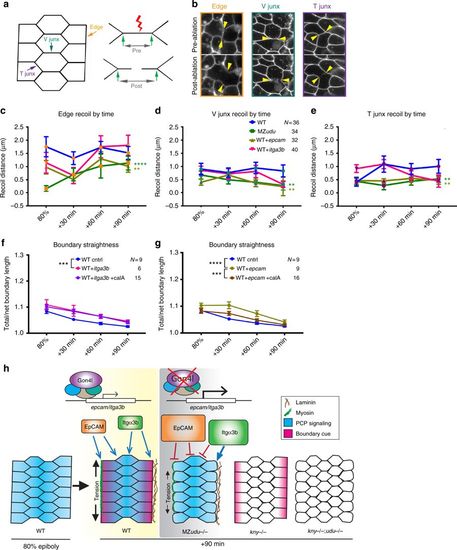
Loss of Gon4l and excess epcam reduce notochord boundary tension. a Diagram of laser ablation experiments to measure tension at axial mesoderm cell interfaces. b Still images from confocal time-lapse movies of each of the three types of cell interfaces (Edge, V junctions, and T junctions) before and after laser ablation. Arrowheads indicate cell vertices adjacent to the ablated interface. Images are representative of 36 independent experiments. c–e Quantification of cell vertex recoil distance immediately after laser ablation of Edge (c), V junction (d), and T junction (e) interfaces at the time points indicated in WT, MZudu−/−, WT epcam overexpressing, and WT itga3b-overexpressing gastrulae. Symbols are means with SEM. Asterisks are colored according to key and indicate significant differences compared to WT controls (two-way ANOVA, **** p < 0.0001, **p < 0.01). f–g Quantification of notochord boundary straightness in WT itga3b (f) or epcam (g) overexpressing embryos with or without Calyculin A (two-way ANOVA, ****p < 0.0001, ***p < 0.001). N indicates the number of embryos analyzed, symbols are means with SEM. h Graphical model of the roles of Gon4l and PCP signaling in regulating ML cell polarity of axial mesoderm cells and notochord boundary formation |
| Fish: | |
|---|---|
| Observed In: | |
| Stage Range: | 75%-epiboly to 90%-epiboly |