
FIGURE
Fig. 5
- ID
- ZDB-FIG-180705-43
- Publication
- Bergmann et al., 2018 - Imaging Neuronal Activity in the Optic Tectum of Late Stage Larval Zebrafish
- Other Figures
- All Figure Page
- Back to All Figure Page
Fig. 5
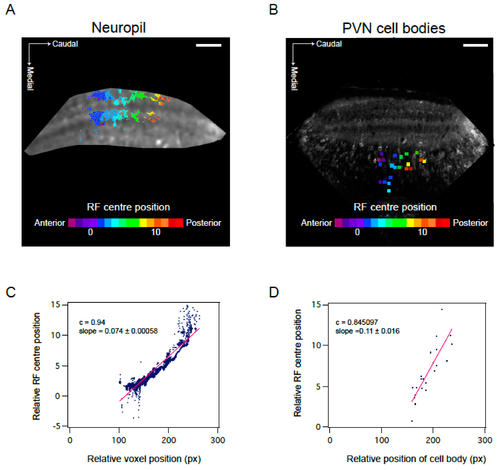
Visuotopic organisation of RF centres in the optic tectum. (A,B) Position of RF centre as determined by parametric fitting of a bivariate Gaussian distribution along anterior—posterior axis shows visuotopic organisation in the neuropil (A) and PVN cell bodies (B). Representative examples of one field of view. (C,D) Visuotopic correlation illustrated as regression fit to RF centre versus relative position of voxel (C) or cell body (D) within the optic tectum (in pixels). Data corresponds to fields of view shown in A and B. c calculated as Pearson’s correlation coefficient. Scale bar: 50 µm.
|
Expression Data
Expression Detail
Antibody Labeling
Phenotype Data
Phenotype Detail
Acknowledgments
This image is the copyrighted work of the attributed author or publisher, and
ZFIN has permission only to display this image to its users.
Additional permissions should be obtained from the applicable author or publisher of the image.
Full text @ J Dev Biol