
- Title
-
Imaging Neuronal Activity in the Optic Tectum of Late Stage Larval Zebrafish
- Authors
- Bergmann, K., Meza Santoscoy, P., Lygdas, K., Nikolaeva, Y., MacDonald, R.B., Cunliffe, V.T., Nikolaev, A.
- Source
- Full text @ J Dev Biol
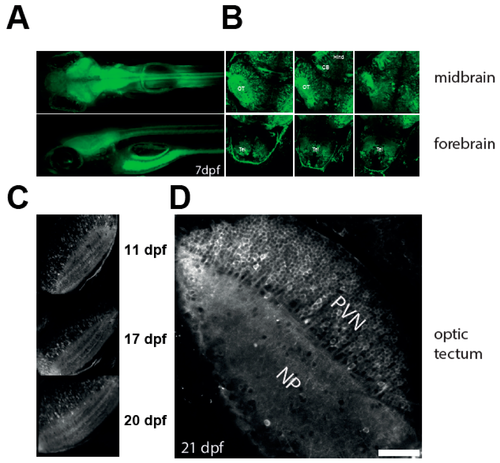
Characterisation of the NBT:GCaMP3 line. (A) Wide fluorescence imaging of 7 dpf larvae expressing GCaMP3 under control of NBT promoter. Top—dorsal view. Bottom—lateral view. (B) Confocal imaging of 7 dpf NBT:GCaMP3 larvae at three different depths. Note that GCaMP3 fluorescence is evident in all major areas of the brain. CB: cerebellum, Hind: hindbrain, OT: optic tectum, Tel: telencephalon. (C–D) GCaMP3 expression is robust in fish aged 10 to 21 dpf. Shown are representative images of the optic tectum at 11, 17, 20 (C), and 21 dpf (D). Note that majority of tectal periventricular cells bodies are labelled with GCaMP3 (D). NP: neuropil, PVN: periventricular neurons. Scale bar—50 µm.
|
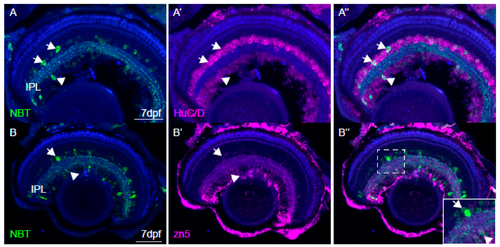
Characterisation of NBT:GCaMP3 expression in the eye of 7 dpf fish. (A) The NBT:GCaMP3 transgene product, visualised with an anti-GFP antibody (green), sparsely labels HuC/D positive neurons (magenta) that project to the synaptic inner plexiform layer (IPL). Amacrine cells are labelled in the inner nuclear layer (arrows) and retinal ganglion cells are labelled in the ganglion cell layer (arrowheads). (B) Anti-GFP antibodies label only a small number of zn5-positive retinal ganglion cells (arrowhead). GFP-positive amacrine cells in the inner nuclear layer are zn5-negative (arrow). (C) The NBT:GCaMP3 transgene is expressed in a small number of retinal ganglion cell axons in the optic nerve (ON, arrowhead). The blue label is a counterstain. Scale bars in A = 40 µm, B = 50 µm, C = 25 µm.
|
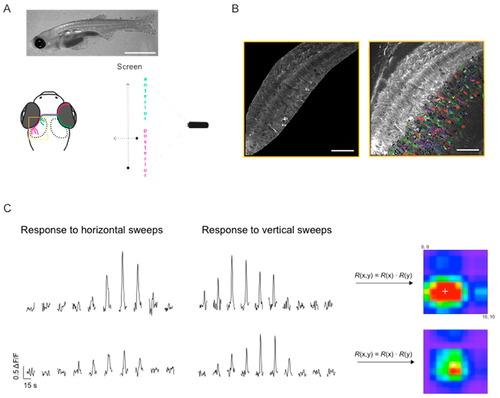
Mapping receptive fields in the optic tectum with small spots. (A) Schematic diagram of the experimental setup for visual stimulation, also illustrating the retinotopic organisation of visual input to the optic tectum: Retinal ganglion cells located in the anterior part (magenta) of the retina, convey information about the posterior part of the visual field and project to the posterior part of the optic tectum and vice versa. Yellow box shows the region imaged in (B). Top—representative image of an 18 dpf larvae (scale bar: 2 mm). (B) Dorsal view of one tectal hemisphere of a transgenic zebrafish larvae (18 dpf) expressing GCaMP3 in both the tectal neuropil (left panel) and cell bodies of PVN neurons (right panel). Confocal time series were analysed either on a voxel-wise basis (neuropil) or on a region of interest (ROI) basis (cell bodies). Cell bodies were randomly colour-coded for better visualisation. (C) Representative ΔF/F traces for two voxels in the neuropil, in response to a small spot moving horizontally and vertically across a 10-by-10 grid on the screen. The stimuli were presented in a pseudo-random order; the response traces shown here were manually sorted for presentation purposes. Responses to vertical and horizontal sweeps were multiplied for each location resulting in the 2D receptive fields (RFs) shown on the right. White cross indicates RF centre as determined by parametric fitting with a bivariate Gaussian distribution. (D) Top: Examples of spatial RFs in the tectal neuropil and cell bodies of PVN neurons, colour-coded to show response amplitudes for each point on a 10-by-10 grid. White cross indicates RF centre as determined by parametric fitting with a bivariate Gaussian distribution. Bottom: 2D RFs fitted with a bivariate Gaussian distribution. Scale bars: 50 μm (fluorescence images), 20 degrees (RFs).
|
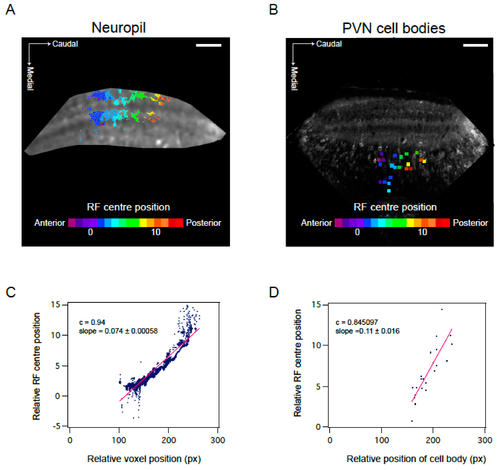
Visuotopic organisation of RF centres in the optic tectum. (A,B) Position of RF centre as determined by parametric fitting of a bivariate Gaussian distribution along anterior—posterior axis shows visuotopic organisation in the neuropil (A) and PVN cell bodies (B). Representative examples of one field of view. (C,D) Visuotopic correlation illustrated as regression fit to RF centre versus relative position of voxel (C) or cell body (D) within the optic tectum (in pixels). Data corresponds to fields of view shown in A and B. c calculated as Pearson’s correlation coefficient. Scale bar: 50 µm.
|
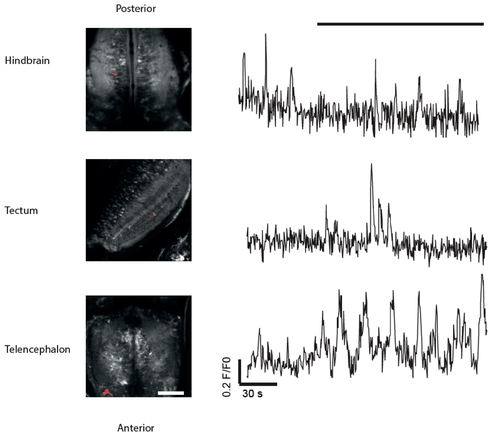
Spontaneous (independent of visual stimulation) activity can be observed in brain areas other than optic tectum using the NBT:GCaMP3 line. Left: Representative images of hindbrain, tectum and the telencephalon of 14 dpf fish used in this experiment. Right: examples of calcium dynamics in individual ROIs in these brain areas. Black bar (top) indicates duration of stimulus (spots moving in rostro-caudal direction). Scale bar = 80 µm. The respective ROIs are highlighted in red.
|
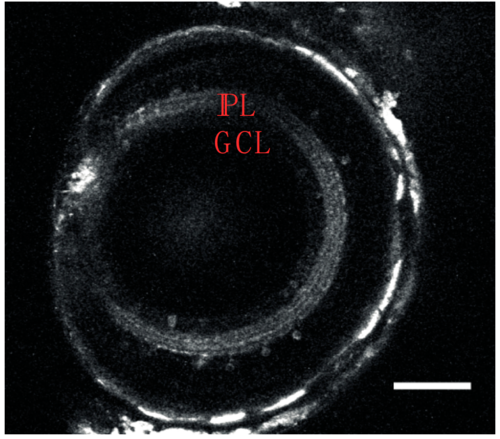
NBT:GCaMP3 transgenic line; expression in the retina (right, 10 dpf). In the eye, GCaMP3 is expressed in the inner plexiform layer (depicted as IPL) and in a small number of cells (2.75 ± 0.9 per field of view, n = 10 fields of view) in the ganglion cell layer (depicted as GCL). For presentation purposes, images were filtered using a Gaussian filter (sigma = 1). |
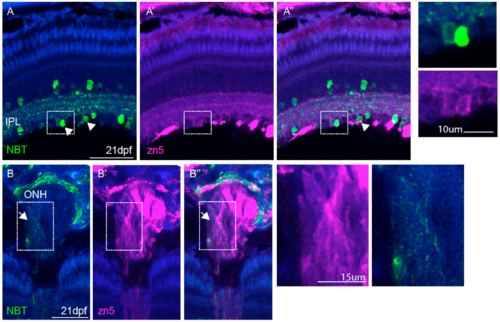
Characterisation of NBT:GCaMP3 expression in the eye of 21 dpf fish. A, a small number of neurons in the ganglion cell layer (arrowheads) are zn5 positive, a marker for retinal ganglion cells. The inset on the right shows labelling of two individual cells in the ganglion cell layer. B, the NBT promoter labels a small number of retinal ganglion cell axons in the optic nerve (ONH, white arrows). The blue label is a DAPI stain. Scale bars in A=50μm, B = 25μm |