FIGURE

Fig. 5

ID
ZDB-FIG-180703-67
Publication
Trivedi et al., 2018 - Multidimensional quantitative analysis of mRNA expression within intact vertebrate embryos
Other Figures
All Figure Page
Back to All Figure Page
Fig. 5

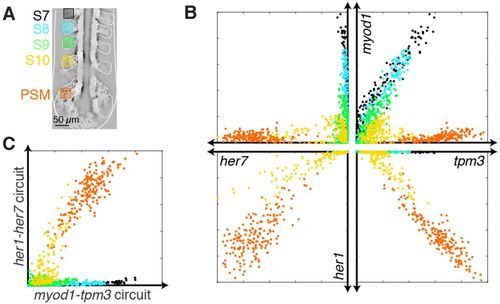
Quantitative snapshots of gene co-expression changes during somite formation and maturation. (A) Anatomical regions of interest within somites S7, S8, S9 and S10, and the presomitic mesoderm (PSM). (B) Expression scatter plots for four target mRNAs shaded by anatomical regions in A. (C) Subcircuit expression scatter plots. Amplitude of her1-her7 subcircuit Embedded Image versus amplitude of myod1-tpm3 subcircuit Embedded Image for the anatomical regions of A. x denotes normalized signal for each target mRNA. Confocal microscopy: mean intensity over five focal planes, 2×2×6 µm voxels. Embryo is fixed at 10 hpf. See section S2.6 in the supplementary material for additional data.

Expression Data

Expression Detail
Antibody Labeling
Phenotype Data

Phenotype Detail
Acknowledgments
This image is the copyrighted work of the attributed author or publisher, and ZFIN has permission only to display this image to its users. Additional permissions should be obtained from the applicable author or publisher of the image. Full text @ Development