
|
Fig. 5
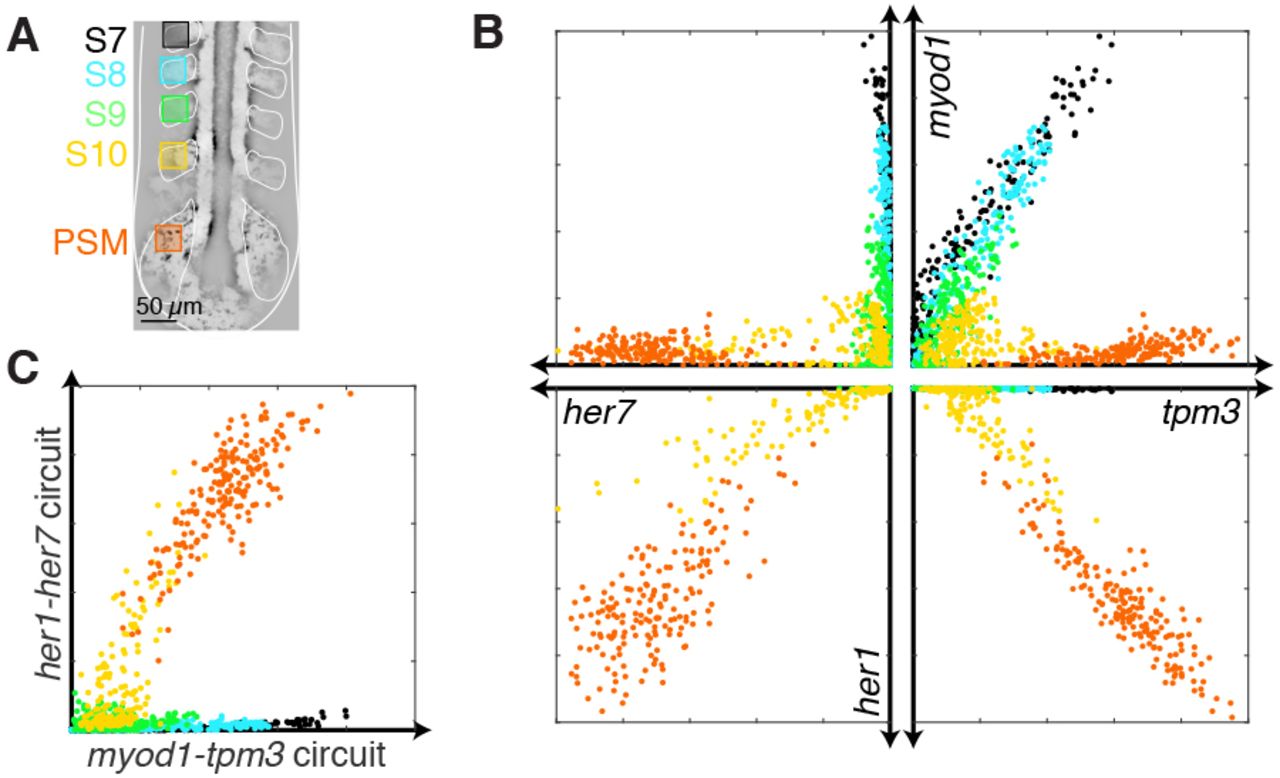
Quantitative snapshots of gene co-expression changes during somite formation and maturation. (A) Anatomical regions of interest within somites S7, S8, S9 and S10, and the presomitic mesoderm (PSM). (B) Expression scatter plots for four target mRNAs shaded by anatomical regions in A. (C) Subcircuit expression scatter plots. Amplitude of her1-her7 subcircuit  versus amplitude of myod1-tpm3 subcircuit
  for the anatomical regions of A. x denotes normalized signal for each target mRNA. Confocal microscopy: mean intensity over five focal planes, 2×2×6 µm voxels. Embryo is fixed at 10 hpf. See section S2.6 in the supplementary material for additional data.