
Fig. 6
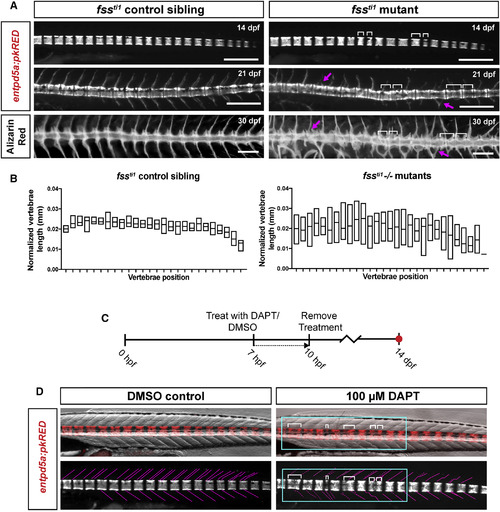
Somite Boundaries Influence the Spatial Distribution of Notochord Sheath Segments (A) Bright-field imaging of entpd5a:pkRED at 14 dpf tbx6 mutants (fssti1) shows that notochord segments (brackets) exhibit high size variability compared with their wild-type (WT) siblings. Following the same fish at 21 dpf, the same pattern was also observed. At 30 dpf, alizarin red stains show that mutants develop severely deformed arches (magenta arrows) and variably sized centra. (B) Quantification of centra length in calcein stained tbx6 mutants (fssti1) at 21 dpf showed greater variability compared with WT siblings (n = 14 and 11 for mutant and WT, respectively, p ≤ 0.0001). (C) Embryos were exposed to 100 μM DAPT or DMSO treatment at 7 hr post-fertilization (hpf) for 3 hr (red dot indicates imaging time point). (D) Embryos exposed to 100 μM DAPT develop focal defects in somite segmentation (cyan box outlines disrupted somite boundaries traced with dotted pink lines). Bright-field imaging of 14 dpf entpd5a:pkRED showed defects in notochord segment size and spacing (brackets) after DAPT was washed out compared with control DMSO-treated animals. Scale bars are 500 μm. |