
Fig. 3
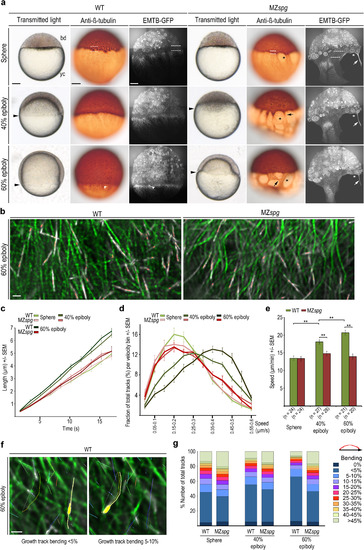
Altered yolk cell microtubule organization and dynamics in MZspgmutant embryos. (a) Wild-type (WT) and MZspg embryo live morphologies (left column: transmitted light, black arrowheads mark blastoderm margin) and microtubule organization in fixed (middle column: anti-β-tubulin immunostain) and live embryos (right column live image of EMTB-3GFP. Confocal z-projection slices). Dashed lines: YSL region between blastoderm and YCL filled with MTOCs (sphere stage); white arrowhead: wild-type YSN nucleus; black asterisks: MZspg microtubule-free patches of the yolk cell; black arrows: abnormal microtubule bundling. bd = blastoderm; yc = yolk cell. Scale bar 100 µm. (b) Live TIRF images of YCL region labeled with EMTB-3GFP (green) and EB3-mCherry (white); wild-type (left) and mutant MZspg (right) embryos at 60% epiboly. Time-series projection of 6 consecutive time points (8.5 s in total). EB3-mCherry track is highlighted in red. Scale bar 4 µm. (c-d) Microtubule growth rates (c) and track velocity distribution (d) in wild-type and MZspg embryos at indicated stages. Error bars - SEM, embryo numbers shown in (e). (e) Average track speed for wild-type and MZspg at indicated stages. Error bars - SEM (** p<0.005, Mann-Whitney test; at sphere N.S.). (f) Track bending. Time series projection (1.7 s per frame, 83.3 s in total) of TIRF image of live EMTB-3GFP (green) and EB3-mCherry (white) labeled YCL region of a wild-type embryo at 60% epiboly. Tracks displacement length in white, tracks color code by software based on time. Left image: yellow highlighted EB3-mCherry track with<5% bending; right image: yellow highlighted track in the 5–10% bending bin. Scale bar 2 µm. (g) Quantification of track bending in wild-type and MZspg at indicated stages, n as in (e). |
| Antibody: | |
|---|---|
| Fish: | |
| Condition: | |
| Anatomical Terms: | |
| Stage Range: | Sphere to 75%-epiboly |
| Fish: | |
|---|---|
| Observed In: | |
| Stage Range: | Sphere to 75%-epiboly |
Reprinted from Developmental Biology, 434(2), Eckerle, S., Ringler, M., Lecaudey, V., Nitschke, R., Driever, W., Progesterone modulates microtubule dynamics and epiboly progression during zebrafish gastrulation, 249-266, Copyright (2017) with permission from Elsevier. Full text @ Dev. Biol.