|
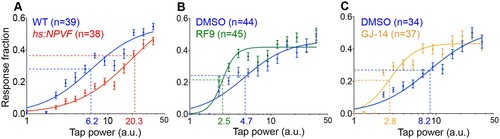
NPVF signaling affects arousal threshold. Representative stimulus response curves generated using a mechano-acoustic stimulus in Tg(hs:NPVF) animals and their WT siblings following heat shock (A), in RF9 and DMSO vehicle treated WT larvae (B), and in GJ-14 and DMSO vehicle treated WT larvae (C). Each data point indicates mean ± SEM. Dashed lines mark the ETP50 value for each genotype or drug treatment. (A) Tg(hs:NPVF) animals had an ETP50 value of 20.3 vs. 6.2 for WT siblings (227% increase, F(1,834)=16.05, p<0.0001 by extra sum-of-squares F test). (B) RF9-treated animals had an ETP50 of 2.5 vs. 4.7 for DMSO-treated siblings (46% decrease, F(1,834)=24.19, p<0.0001 by extra sum-of-squares F test). (C) GJ14-treated animals had an ETP50 of 2.8 vs. 8.2 for DMSO-treated siblings (65% decrease, F(1,834)=49.47, p<0.0001 by extra sum-of-squares F test). n = number of animals.
|