
Fig. S2
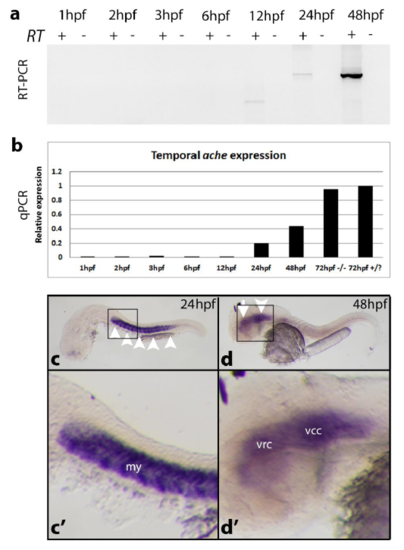
ache expression analysis in AB line at different developmental stages. (a) ache expression was analyzed by using ache coding sequence spanning RT-PCR primers at 1, 2, 3, 6, 12, 24, and 48hpf. Amplification was performed for 35 cycles. cDNA was prepared from 1 microgram of total RNA. ache expression started between 12-24hpf. At 12 hpf there was a non-specific PCR band different than the expected amplicon size of 1905bp. (b) qPCR quantitative ache expression analysis with a new set of cDNA (N = 1 experiment; n = 20 embryos/group). In addition to the above stages RNA from ache-/- and +/? larvae at 72 hpf were included into analysis (N = 1 experiment; n = 20 embryos/group). At 72hpf ache expression was further increased compared to 48hpf expression level. elfa was used as housekeeping gene. ache in situ hybridization probes used to detect mRNA localization at (c, c’) 24 hpf where myotome (arrowheads) was stained; at (d, d’) 48 hpf where ventrorostral (arrow) and ventrocaudal clusters (arrowhead) in the inner brain were labeled. my: myotome, vrc: ventrorostral cluster, vcc: ventrocaudal cluster. |
| Gene: | |
|---|---|
| Fish: | |
| Anatomical Terms: | |
| Stage Range: | Prim-5 to Protruding-mouth |