
- Title
-
Development of a novel zebrafish xenograft model in ache mutants using liver cancer cell lines
- Authors
- Avci, M.E., Keskus, A.G., Targen, S., Isilak, M.E., Ozturk, M., Atalay, R.C., Adams, M.M., Konu, O.
- Source
- Full text @ Sci. Rep.
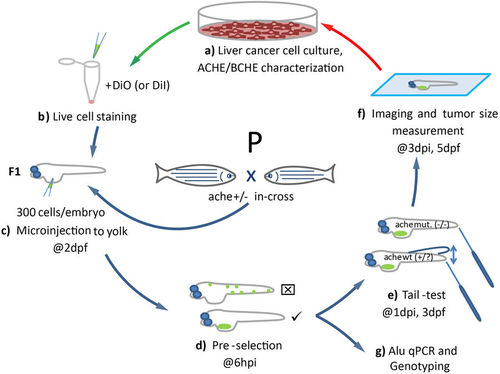
Schematic representation of the development of the liver cancer xenograft model in zebrafish ache mutants. (a) Liver cancer cells are grown in culture and characterized for ACHE/BCHE expression and activity. (b) Selected cell lines are harvested and stained with live dye DiO (or DiI for ALU quantification). (c) Embryos from ache heterozygous in-cross are injected with 300 cells into their yolk sac at 2 dpf. (d) At 6 hpi, embryos with positive signal are selected and embryos with signal from outside the injection site are not used. (e) After blind injection, mutant larvae are separated from +/? by a touch-evoked tail response test (tail-test). (f) All larvae are fixed and mounted before tumor size is measured and compared between mutant and wild-type larvae. (g) Alternatively, larvae fixed for ALU based xenograft quantification assay. |

ZFIN is incorporating published figure images and captions as part of an ongoing project. Figures from some publications have not yet been curated, or are not available for display because of copyright restrictions. PHENOTYPE:
|
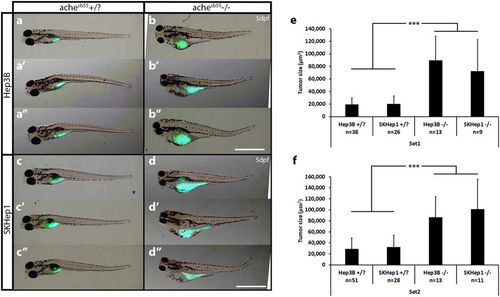
ache mutant embryos develop larger tumors with both Hep3B and SKHep1 human liver cancer cell xenotransplantation. At 2 dpf, embryos collected from ache+/− in-cross were injected with either Hep3B (a,b) or SKHep1 (c,d) cells. At 3 dpf, tail test was applied for phenotypically separating wild-type (a,c) and mutant embryos (b,d). At 3 dpi, larvae were fixed and imaged for analyzing tumor development (representative of Hep3B and SKHep1 injected groups, three different larvae are shown in a, a’, a”, b, b’, b” and c, c’, c”, d, d’, d”, respectively). Merged images from brightfield and GFP channels were shown. DiO labeled tumor masses can be clearly seen in green. Tumor sizes were measured in ImageJ using the fluorescent signal alone. In total 89 Hep3B injected ache+/?, 26 Hep3B injected ache−/−, 54 SKHep1 injected +/? and 20 SKHep1 injected −/− larvae were analyzed across two independent experiments. Results from each experimental set are separately graphed (e,f). Error bars represent the standard deviation. Bar = 1 mm. PHENOTYPE:
|
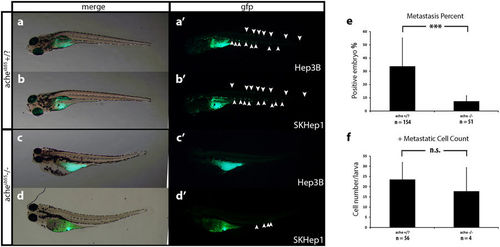
Comparison of metastasis in ache wild-type and mutant larvae. Representative metastatic larva images from Hep3B (a) and SKHep1 (b) injections into ache+/? (n = 154) larvae are shown. Green fluorescent dye DiO labeled migrated cells can be seen both in Hep3B (a’) and SKHep1 (b’) cell injections. Injection of Hep3B (c) and SKHep1 (d) into yolk sac of ache−/− (n = 51) larvae did not show a metastatic phenotype (c’,d’) (when there were more than 5 cells in tail region that embryo was counted as positive for metastasis, see (d’) which was counted as negative for metastasis). (e) Positive metastasis percent in ache wild-type and mutant groups were compared where there were significantly more metastatic larvae in ache wild-type group (P = 0.0002, chi-square test). (f) To see the effect of metastasis on local tumor size, tumor sizes of metastasis positive and negative groups were compared. Metastasis negative larvae (n = 129) showed a trend for larger tumors although non-significant (P = 0.1112, T-test) when compared to metastasis positive larvae (n = 60). n.s = not significant. PHENOTYPE:
|
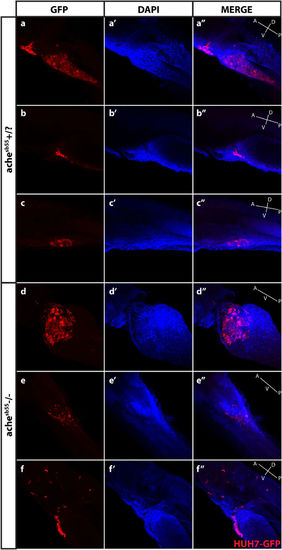
Optical sectioning and examination of Huh7-GFP xenografted larvae. Larvae (ache+/? and ache−/−) injected with Huh7-GFP cells were stained with GFP primary antibody and Cy3 tagged secondary antibody, and counterstained with DAPI and examined histologically by optical sectioning using a Zeiss LSM 880 confocal microscope. (a–f) At 20× magnification, z-stacks at 10 micron intervals were obtained and consecutive images were Z-projected to obtain these 2D images by maximum intensity projection in ImageJ. Tumor masses can be clearly seen in both images in red. (a’–f’) Same larvae were counterstained with DAPI for marking nuclei. (a”–f”) Merged images were presented. In the fish body schematic, the letters are abbreviations for A: anterior, P: posterior, D: dorsal, V: ventral. |
|
ZFIN is incorporating published figure images and captions as part of an ongoing project. Figures from some publications have not yet been curated, or are not available for display because of copyright restrictions. |
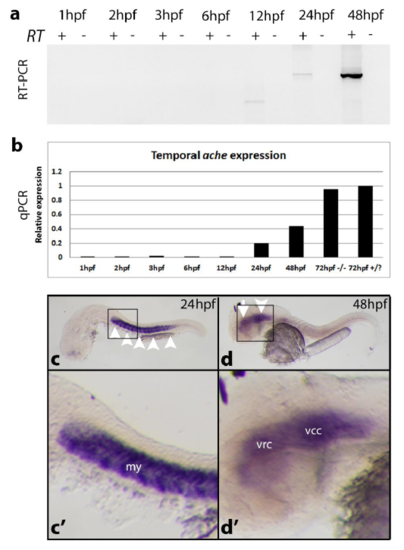
ache expression analysis in AB line at different developmental stages. (a) ache expression was analyzed by using ache coding sequence spanning RT-PCR primers at 1, 2, 3, 6, 12, 24, and 48hpf. Amplification was performed for 35 cycles. cDNA was prepared from 1 microgram of total RNA. ache expression started between 12-24hpf. At 12 hpf there was a non-specific PCR band different than the expected amplicon size of 1905bp. (b) qPCR quantitative ache expression analysis with a new set of cDNA (N = 1 experiment; n = 20 embryos/group). In addition to the above stages RNA from ache-/- and +/? larvae at 72 hpf were included into analysis (N = 1 experiment; n = 20 embryos/group). At 72hpf ache expression was further increased compared to 48hpf expression level. elfa was used as housekeeping gene. ache in situ hybridization probes used to detect mRNA localization at (c, c’) 24 hpf where myotome (arrowheads) was stained; at (d, d’) 48 hpf where ventrorostral (arrow) and ventrocaudal clusters (arrowhead) in the inner brain were labeled. my: myotome, vrc: ventrorostral cluster, vcc: ventrocaudal cluster. EXPRESSION / LABELING:
|
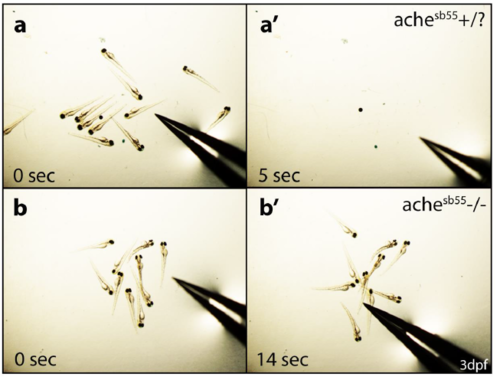
achesb55 mutant selection and characterization. Embryos obtained from achesb55 heterozygote parental fish were grouped using “tail-test”. (a) At 3 dpf, ache wild type siblings were able to swim following consecutive disturbance (a’). (b) Whereas, achesb55 homozygous mutant fish were paralyzed due to excess ACh accumulation and could not move after touching their tails (b’). PHENOTYPE:
|
|
ZFIN is incorporating published figure images and captions as part of an ongoing project. Figures from some publications have not yet been curated, or are not available for display because of copyright restrictions. PHENOTYPE:
|
|
ZFIN is incorporating published figure images and captions as part of an ongoing project. Figures from some publications have not yet been curated, or are not available for display because of copyright restrictions. PHENOTYPE:
|