
Fig. 5
- ID
- ZDB-FIG-180418-5
- Publication
- Chen et al., 2017 - Live Fluorescent Staining Platform for Drug-Screening and Mechanism-Analysis in Zebrafish for Bone Mineralization
- Other Figures
- All Figure Page
- Back to All Figure Page
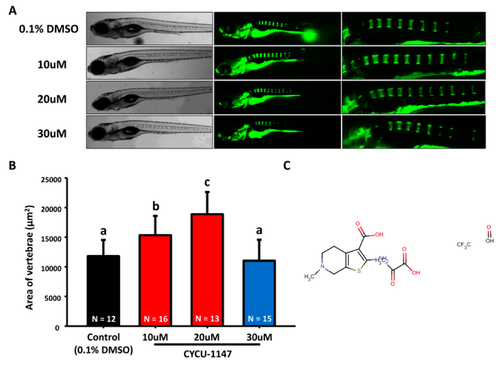
Increase of mineralization in BML-267-treated zebrafish. (A) The gross morphology of zebrafish aged at 7 dpf which have been treated with different concentrations of BML-267 (10, 20, and 30 µM, left bright-filed panel) from 3 dpf onwards. Calcein staining on control and BML-267-treated embryos at 7 dpf (right green fluorescent panel); (B) Quantification of mineralization degree detecting the fluorescence intensity at the area of centrum form ring in the notochord. (values are mean ± SD; tested by one-way ANOVA pairwise comparison; N = fish number; Different letters indicate significant differences) (C) Chemical structure of BML-267. |