
Fig. 6
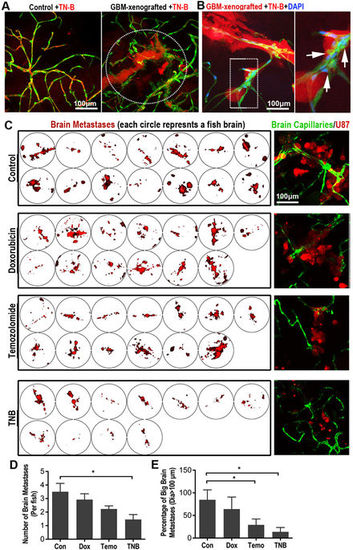
TN-B inhibits the invasion and growth of GBM xenografts in zebrafish brain. (A) TN-B was directly injected into the circulation of 5dpi zebrafish with or without GBM xenografts. Confocal images were taken 1 hour post tracer and drug injection. Dotted circle indicating the tumor area. (B) TN-B and DAPI was injected into the circulation of zebrafish (with 5dpi red GBM xenograft). Confocal images at 8 hours post injection showed the DAPI was still hold in cerebral capillaries (Arrows), indicating the BBB was not destroyed by the TN-B treatment. Area in dotted box was magnified right. (C) Drugs (Doxorubicin, Temozolomide, TN-B and control DMSO) were directly added into the culture medium of living zebrafish embryos (4dpf), which were implanted with GBM-U87 at 3dpf as previously described (n = 20 in each group). After 3days treatment, all the brains of zebrafish embryos were imaged with confocal microscope. Left panels show the intracranial GBM metastases (red) in each zebrafish brain. Right panels show representative images of the intracranial GBM cells (red) and cerebral capillaries (green) with high resolution. (D,E) Quantitative analysis of the number of whole GBM metastases or relative big GBM metastases in zebrafish brain with or without drug treatment at 7dpf, diagrams showing means and SEM. |