
Fig. 2
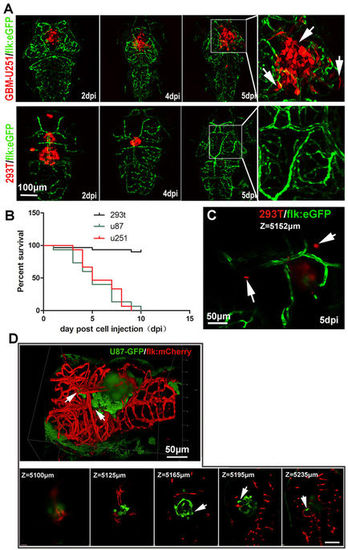
Establishment of GBM xenografts in flk:eGFP Casper zebrafish. (A,B) 200–500 GBM tumor cells (U87-RFP, U251-RFP) were intracranial implanted into 3dpf flk:eGFP Casper zebrafish and monitored by confocal microscope every 24 hours, 293T-RFP cells implantation was set as control. Areas in dotted boxes were magnified right, arrows indicating infiltrating tumor cells. (B) The survivorship curve of U87 and U251 tumor-bearing zebrafish and control 293 T injected zebrafish. (C) A high-resolution image of intracranially implanted 293t-RFP cells at 6dpf, arrows indicating the cell debris. (D) A reconstructed 3D image of a U87-GFP xenograft in the deep brain of flk:mCherry zebrafish at 6dpf, arrows indicating infiltrating tumor cells. Z-stack serial images show the depth of the GBM xenograft in zebrafish brain, arrows indicating infiltrating tumor cells. |
| Genes: | |
|---|---|
| Fish: | |
| Condition: | |
| Anatomical Term: | |
| Stage Range: | Day 5 to Days 7-13 |