
FIGURE
Fig. 1
- ID
- ZDB-FIG-180322-17
- Publication
- Wang et al., 2017 - The construction of intrahepatic cholangiocarcinoma model in zebrafish
- Other Figures
- All Figure Page
- Back to All Figure Page
Fig. 1
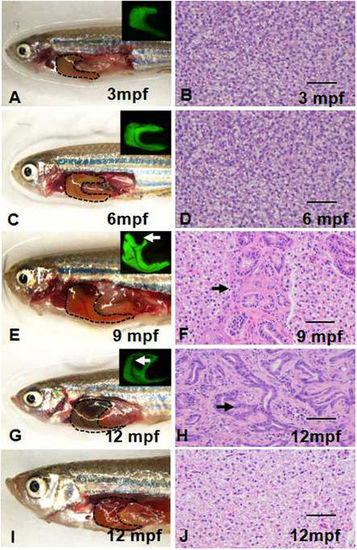
The liver tumor in Tg(fabp10:nras 61K) transgenic zebrafish. The fluorescence of EGFP was used to detect the nras 61K gene expression. (A,C,E,G) Brightfield and fluorescence (insets) images displaying the gross morphology of F4 Tg(fabp10:nras 61K) transgenic zebrafish at 3, 6, 9 and 12 mpf. Tumor protrusions are indicated by arrowheads. (B,D,F,H) Histology of F4 Tg(fabp10:nras 61K) transgenic zebrafish at 3, 6, 9 and 12 mpf. (I) Brightfield images displaying the gross morphology of WT zebrafish at 12 mpf. (J) Histology of WT zebrafish at 12 mpf. Dotted areas indicate liver regions. Scale bars: 50 µm. |
Expression Data
Expression Detail
Antibody Labeling
Phenotype Data
| Fish: | |
|---|---|
| Observed In: | |
| Stage: | Adult |
Phenotype Detail
Acknowledgments
This image is the copyrighted work of the attributed author or publisher, and
ZFIN has permission only to display this image to its users.
Additional permissions should be obtained from the applicable author or publisher of the image.
Full text @ Sci. Rep.