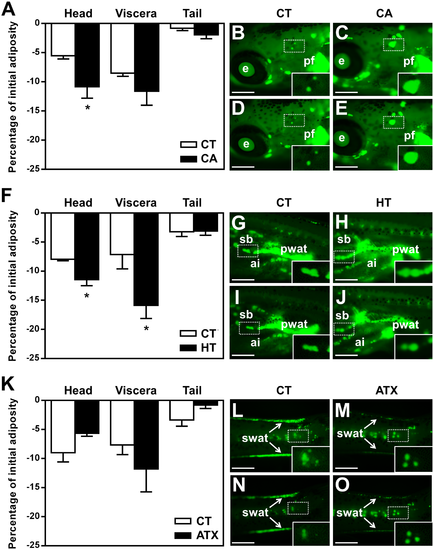
Differential effect of selected vegetal molecules of plant origin on WAT dynamics in different body parts of zebrafish larvae. Quantitative analysis of WAT dynamics was performed according to the ZOT protocol and the results are expressed as a percentage of initial adiposity relative to the amount of WAT fluorescence signal attached to each body region. Fasting larvae were exposed to 50 μM CA in 0.1% DMSO (A, C, E), 100 μM HT in 0.1% DMSO (F, H, J), 100 μM ATX in 0.1% DMSO (K, M, O), or 0.1% DMSO as a vehicle CT (A, B, D, F, G, I, K, L, N). Images of relevant regions in representative larvae are presented: head (B-E), viscera (G-J), and tail (L-O). Lateral views, anterior part on the left and dorsal part at the top, under fluorescence microscope after Nile red staining, recorded before (B, C, G, H, L, M) and after 24 h treatment (D, E, I, J, N, O) with (CA, HT, ATX) or without (CT) exposure to the compounds. Insets in each image are enlarged views of isolated adipocytes or groups of adipocytes from each panel, marked by a white rectangle. Values are mean + SEM, n = 4–6 independent experiments (10 animals per group). *p ≤ 0.05 compared to control for each region, using Student's t-test. Scale bar, 500 μm. Abbreviations: e, eye; pf, pectoral fin; pwat, perivisceral white adipose tissue; sb, swim bladder; ai, anterior intestine; swat, subcutaneous white adipose tissue.
|
