
FIGURE
Fig. 1
- ID
- ZDB-FIG-180119-24
- Publication
- Bancelin et al., 2017 - Probing microtubules polarity in mitotic spindles in situ using Interferometric Second Harmonic Generation Microscopy
- Other Figures
- All Figure Page
- Back to All Figure Page
Fig. 1
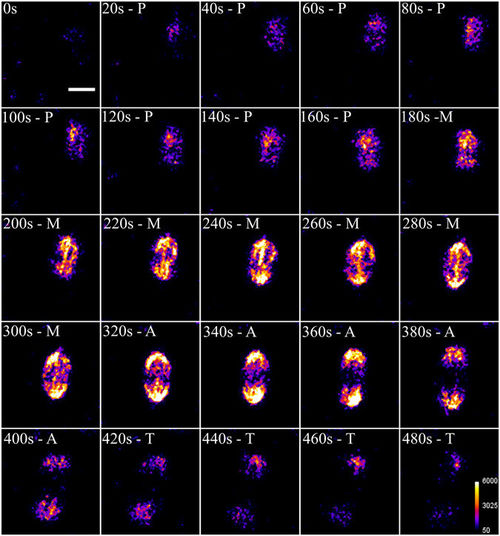
Time-lapse SHG imaging of mitotic spindles during mitotic division of a zebrafish embryo. Prometaphase (P; 20–160 s), metaphase (M; 180–300 s), anaphase (320–400 s) and telophase (420–480 s). Average power at focus: 150 mW, photomultiplier tube set at 1100 V. Scale bar: 10 µm. |
Expression Data
Expression Detail
Antibody Labeling
Phenotype Data
Phenotype Detail
Acknowledgments
This image is the copyrighted work of the attributed author or publisher, and
ZFIN has permission only to display this image to its users.
Additional permissions should be obtained from the applicable author or publisher of the image.
Full text @ Sci. Rep.