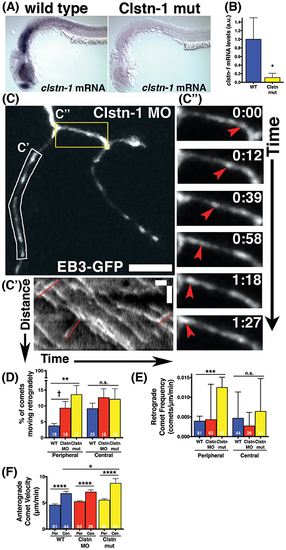
Clstn-1 loss-of-function (lof) disrupts MT polarity in sensory neuron peripheral axons. (A) In situ hybridization showing clstn-1 mRNA expression in 24 hpf wild type or Clstn-1−/− embryos. (B) qPCR results showing clstn-1 mRNA expression levels normalized to an EF1α positive control (wild type mRNA = −4.681, n = 3 biological replicates of 50 embryos; Clstn-1−/− mRNA = −7.616, n = 2 biological replicates of 50 embryos; *p = 0.014 student's t-test). (C) RB neuron labeled with EB3-GFP in Clstn-1 MO injected embryo. Retrograde comets appear frequently in Clstn-1 lof peripheral axons. Scale bar is 10 μm. (C') Kymograph of the white boxed region in C shows several retrograde comets highlighted in red. Scale bars are 5 μm (y) and 1 min (x). (C”) Time-lapse sequences of the yellow boxed area show a retrograde comet traveling between two branch points (red arrowheads). Time is shown in min:sec. (D) Clstn-1 lof embryos have a higher percentage of retrograde comets than wild type (WT). (WT peripheral = 3.69%, n = 18 neurons; Clstn-1 MO peripheral = 9.29%, n = 18 neurons, †significant via student's t-test comparison to wild type, p = 0.012, but not with Dunnett's post-test after one-way ANOVA p = 0.086; Clstn-1−/− peripheral = 13.55%, n = 17 neurons, ***p = 0.0009 student's t-test, **p = 0.0017 Dunnett's post-test; p = 0.0034 one-way ANOVA). In central axons, there is no significant difference in percentage of retrograde comets between wild type and Cltn-1 lof. (WT central = 9.11%, n = 25 neurons; Clstn-1 MO central = 12.60%, n = 18 neurons, p = 0.27 student's t-test, p = 0.49 Dunnett's post-test; Clstn-1−/− central = 12.10%, n = 16 neurons, p = 0.39 student's t-test, p = 0.61 Dunnett's post-test; one-way ANOVA p = 0.54). (E) Clstn-1−/− neurons have a higher frequency of retrograde comets in peripheral axons than wild type (mean WT peripheral frequency = 0.0039 comets/μm/min, n = 81 axon segments; mean Clstn-1 MO peripheral frequency = 0.0043 comets/μm/min, n = 63 axon segments, p = 0.90 Dunnett's post-test; mean Clstn-1−/− peripheral frequency = 0.012 comets/μm/min, n = 47 axon segments, ***p = 0.0007 Dunnett's post-test; one-way ANOVA ***p = 0.0006). (F) In Clstn-1 lof neurons anterograde comets in central axons travel faster than those in peripheral axons, similar to wild type, (mean Clstn-1 MO peripheral velocity = 5.23 μm/min, n = 63 axon segments, mean Clstn-1 MO central velocity = 7.05 μm/min, n = 26 axon segments, ****p < 0.0001 student's t-test; mean Clstn-1−/− peripheral velocity = 5.53 μm/min, n = 48 axon segments, mean Clstn-1−/− central velocity = 8.74 μm/min, n = 24 axon segments, ****p < 0.0001 student's t-test, wild type velocity data repeated from Figure 1 show here again for comparison). Clstn-1−/− anterograde comets in central axons travel faster than their wild type counterparts (WT vs. Clstn-1−/− mean central velocity *p = 0.031 Dunnett's post-test, WT vs. Clstn-1 MO mean central velocity: p = 0.91 Dunnett's post-test, *p = 0.048 one-way ANOVA).
|
